Value Stream Mapping
Value Stream Mapping tools can be accessed via the VSM Symbols button on the FlowBreeze toolbar. In addition to the VSM symbols, FlowBreeze also features a VSM Template Generator, which is covered here.
Accessing the Value Stream Mapping Symbols
Clicking the VSM Symbols button opens the Value Stream Mapping Symbols dialog. To add a VSM symbol to the worksheet, follow these steps:
- Select the worksheet cell where you want the symbol to be placed. For Value Added-Time and Non Value-Added Time blocks, the selection can span multiple cells.
- Click on the symbol to add.
- If there are any Options associated with the symbol, enter them as needed.
- Click the Add Symbol button on the dialog.
Notes:
- If a symbol has no Options associated with it, you can simply double-click the icon to add it to the worksheet.
- The symbol text font is set in the Settings screen.
Available symbol set
FlowBreeze features Operations, Inventory, Movement, and Data symbols, as shown in the images below.
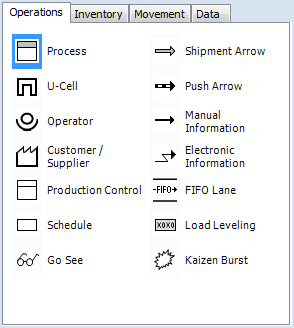
Operations Symbols
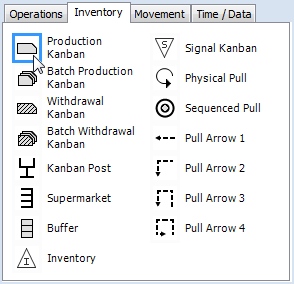
Inventory Symbols
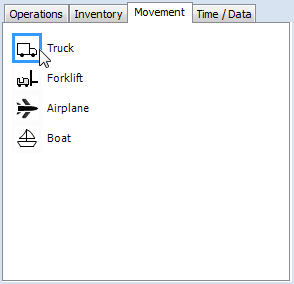
Movement Symbols
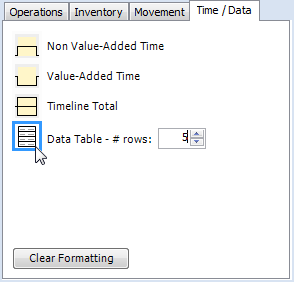
Time Data Blocks
VSM Symbol options
When you click one of the symbols above, the following options fields are shown based on the symbol type.
- Title and text: Production Control and Process symbols have separate title and text fields.
- Text: numerous shapes allow you to add text.
- Angle: You can preset the angle for arrows. Clicking the angle selector will snap to 45 degree increments, and dragging the selector will snap to 5 degree increments.
- Data table size: set the number of rows in the data table.
- Pull arrow direction: set the direction to left-to-right or right-to-left.
Clear Formatting: The timelines and data tables are created by formatting cells with borders and shading. As the name implies, the Clear Formatting button clears the borders and shading.