Flowcharting in Excel Series
How to Convert a Plain Excel Flowchart into a Process Map
By Nicholas Hebb
What Do You Mean By "Process Map"?
[Ed. Note: Unfortunately, Process Map is one of those terms that means different things to different people. One common usage is to describe a map of the top-level process interactions in a business, such as to fulfill the requirements of TS 16949 section 4.1 in the automotive manufacturing sector. Another common usage is to describe a SIPOC Diagram, where SIPOC stands for Suppliers Inputs Process Outputs Customers. That's close, but not quite what we're after here.]
Flowcharts are good for displaying the process flow graphically, but they don't really take it to the next level of analysis. To do that, you need to create a Process Map which lists the cost of quality attributes for each process steps. Common cost of quality attributes identified or measured are:
- Who is responsible for each process step?
- What is the cycle time?
- Where are the delays?
- Are there duplications of effort?
- How many defects are there per unit?
- Is the process step value added or cost-only added?
- And so forth ...
Excel Flowchart Wizard
FlowBreeze is a flowchart add-in for Microsoft Excel that makes creating flowcharts simple and pain free. Free 30-Day Trial.Excel 2007 - 2019 Versions
This article was originally written for Excel 2003, but the majority of it remains true for Excel 2007, 2010, 2013, 2016, and 2019. The main differences are:
- The VBA editor and other Macro tools are accessed through the Developer tab on the ribbon. If you don't see this tab on your ribbon, you will need to enable it through Excel Options.
- Excel 2007 and later use the .xlsm extension for files that contain macros. You can open the download (below) in compatibility mode, but you will need to save it as a macro enabled .xlsm file.
A Little VBA To The Rescue
The beauty of flowcharting in Excel is that you can add analysis to your business process diagrams easily. One way to do it would be to add the attributes on the worksheet next to each process map symbol. That would be OK, but not optimal. Better yet would be if we could extract all the text from the process map symbols and build a table to list each metric. Instead of re-typing all the text, we can automate the text extraction with a little VBA.
 If you're not familiar with it, VBA stands for Visual Basic for Applications. It's the code that runs macros in
Excel (and other Office applications). Sound too scary? It's not so bad, and this article will walk you through
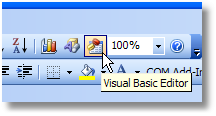
it. First you need to open up the Visual Basic Editor (VBE) in Excel by clicking on the toolbar button shown to
the right.
If you're not familiar with it, VBA stands for Visual Basic for Applications. It's the code that runs macros in
Excel (and other Office applications). Sound too scary? It's not so bad, and this article will walk you through
it. First you need to open up the Visual Basic Editor (VBE) in Excel by clicking on the toolbar button shown to
the right.
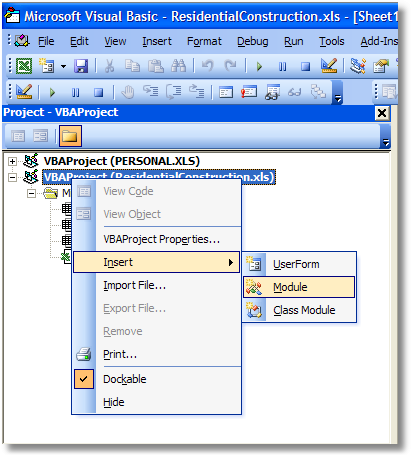
Once you have the Visual Basic Editor open, you will need to add a code module. This is done by right-clicking on the VBAProject project name and selecting Insert > Module from the context menu (pop-up menu) as shown in the picture below. Note that each Excel file has its own VBAProject name, so if you have multiple files open, make sure you select the right one (e.g., you can see below that I was working in ResidentialConstruction.xls at the time I took the screen shot) .
Now, you can just copy and paste the following code into the module window or you can download the example flow chart from the bottom of this page.
Option Explicit
Public Sub ExtractTextFromFlowchartSymbols()
        Dim ws  As Worksheet
        Dim shp As Shape
        Dim txt As String
        Dim rng As Range
        Dim i   As Long
        Set ws = ActiveSheet
        On Error Resume Next
        txt = "Select the cell to output the flow chart symbol text"
        Set rng = Application.InputBox(txt , _
                                "Process Map Sequence List Output", , , , , , 8)
        If rng Is Nothing Then Exit Sub ' user selected Cancel
        On Error GoTo Err_Handler
        rng.Select
        ' To add more columns, just add them to the end of the following
        ' line, with each heading in quotes and separated by commas.
        ' Cycle Time and Defects per Unit can also be replaced with
        ' whatever cost of quality attributes you want to measure.
        ' The underscore (_) lets you wrap multiple lines of code.
        CreateHeading rng, "Order", "Process Step", _
                                    "Cycle Time", "Defects per Unit"
        i = 1
        For Each shp In ws.Shapes
                If shp.AutoShapeType >= 61 And shp.AutoShapeType <= 88 Then
                        txt = Trim$(shp.TextFrame.Characters.Text)
                        If UCase$(txt) <> "START" And UCase$(txt) <> "END" Then
                                rng.Offset(i, 0).Value = i
                                rng.Offset(i, 1).Value = txt
                                i = i + 1
                        End If
                End If
        Next
        rng.Columns(2).EntireColumn.AutoFit
        ' Place a single apostrophe (') in front of the next 3 lines of
        ' code if you don't want to be annoyed by this reminder each time.
        txt = "To change the order of the process steps, " & _
                    "edit the values in the Order column then " & _
                    "sort the process steps"
        MsgBox txt, , "Flowchart Text Extraction Complete"
Exit_Handler:
        Set rng = Nothing
        Set shp = Nothing
        Set ws = Nothing
        Exit Sub
Err_Handler:
        MsgBox Err.Number & vbNewLine & Err.Description
        Resume Exit_Handler
End Sub
Private Sub CreateHeading(ByRef r As Range,
                                                    ParamArray ColumnNames() As Variant)
        Dim idx As Integer
        For idx = 0 To UBound(ColumnNames)
                With r.Offset(0, idx)
                        .Value = ColumnNames(idx)
                        .Font.Bold = True
                        With .Borders(xlEdgeBottom)
                                .LineStyle = xlContinuous
                                .Weight = xlThin
                                .ColorIndex = xlAutomatic
                        End With
                        .EntireColumn.AutoFit
                End With
        Next
End Sub
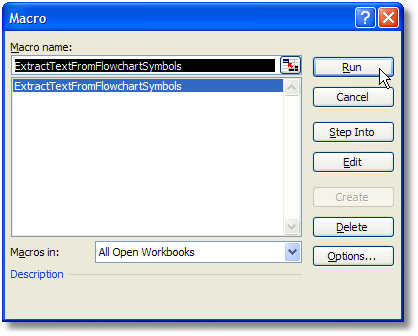
Assuming you've already created your flowchart in Excel (using FlowBreeze Flow Chart Software, of course) , the next step is to run the macro above. To do this, select Tools > Macro > Macros from the main Excel menu (or just use the shortcut: Alt + F8).
Then select the ExtractTextFromFlowchartSymbols macro and click the Run button as shown in the image below.
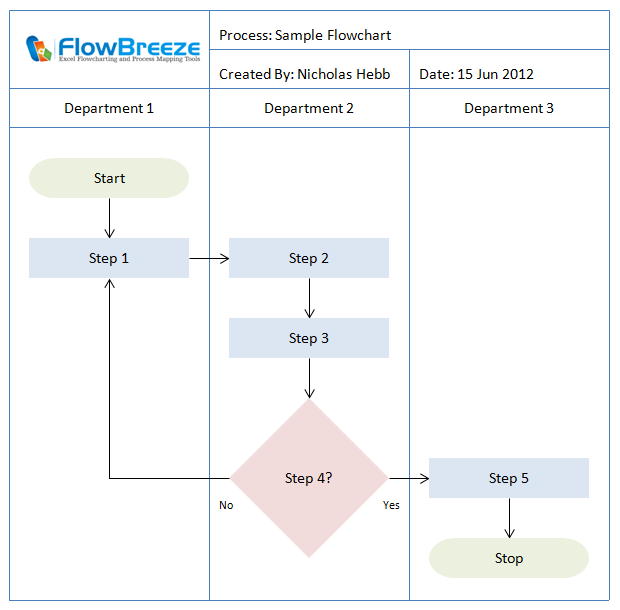
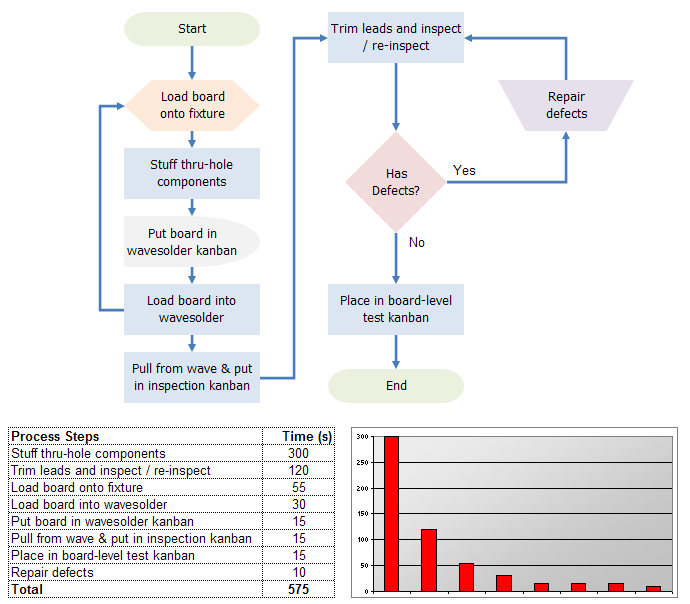
The macro will prompt you to select the worksheet cell to place the Process Map table, then it will generate the table for you. So for an Excel flowchart that looks like this ...
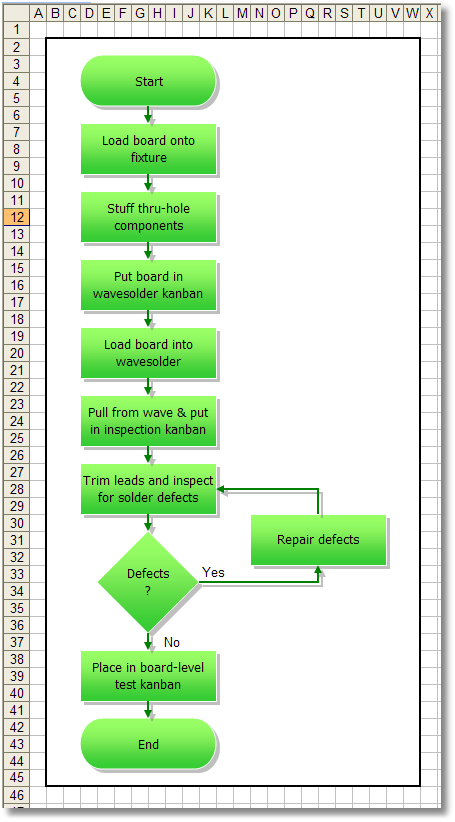
... the macro will generate a process map table that looks like this:
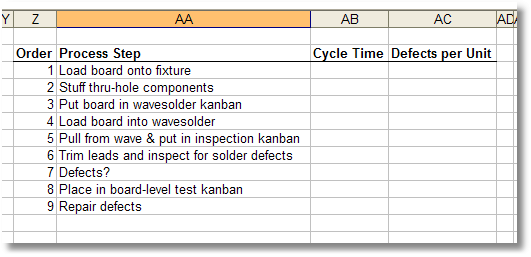
Afterwards, you will probably need to clean up the process map table a little bit. The process steps may be out of order and decision steps may be redundant of the previous step, such as the the "Defects?" step above. The nice thing about automating this is that you can take it to the next level and create a workbook with different child process maps on each worksheet and write formulas to roll the data up to the parent process level.
Download an Example Flow Chart
Click Here to Download the Flow Chart to Process Map Example
Note: The Excel file contains the macro listed above, so depending upon your security settings, you may get a warning when you try to open it or your system may not let you open it at all.
About the Author
Nicholas Hebb
Nicholas Hebb is the owner and developer of BreezeTree Software, makers of FlowBreeze Flowchart Software, a text-to-flowchart maker, and Spreadspeed, an auditing and productivity toolset for Microsoft Excel®.