Flowcharting in Excel Series
Exporting an Excel Flowchart as a Picture
By Nicholas Hebb
Flowchart Export Options
Copying & Pasting Flowcharts and Drawings as Pictures
When you export a flowchart to another application (such as Microsoft Word), you have two options: you can copy/paste it as a drawing object or copy/paste it as a picture. This article covers exporting flowcharts as Pictures. To read about copying flowcharts as drawing objects, see the article: Flowcharting with Excel: Copying Flowcharts as Drawing Objects.
Excel Flowchart Wizard
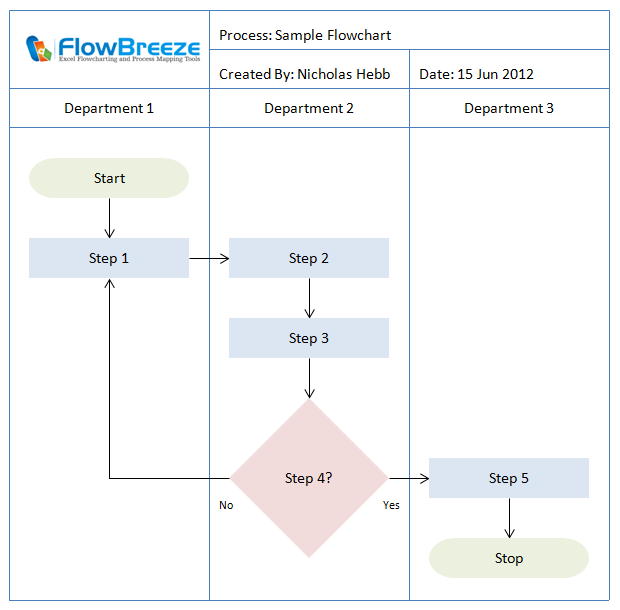
FlowBreeze is a flowchart add-in for Microsoft Excel that makes creating flowcharts simple and pain free. Free 30-Day Trial.Before you Copy
Before you copy your flowchart, it is a lot easier to work with if you select all the shapes and group them into a single drawing object. The can be done using the Draw > Group command from the Drawing toolbar.
Step 1 - How to Copy a Picture
This isn't as "well, duh!" as you might think
This should be a simple topic, but it isn't. Unfortunately, there isn't One True WayTM to copy Excel drawing objects and get good results. This article covers 6 different ways to do it. The results you get with each method can vary based on your system, Microsoft Office version, and the formatting of the shapes. Sometimes you have to try all 6 ways to get the results you like.
Method 1: Simple Copy
Obviously this is the easiest option, and if it gives you satisfactory results, then go no further.
Methods 2-4: Copy Picture
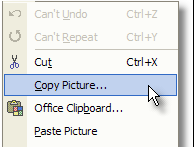
Normally when you select an item and click the Edit menu, you see Copy among the list of menu items. But there is a secret "hidden" menu item you may not know about. If you hold down the Shift key when you select Edit, a Copy Picture menu item appears (as shown in the picture to the right).
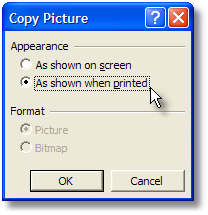
Select Copy Picture, and you'll get the Copy Picture dialog (imagine that!) shown to the right. This dialog gives you 3 options - it may not look that way, but trust me and read on.
The 3 possible copying options are:
- Appearance: "As shown when printed" + Format: "Picture" (you can't select bitmap for the "... printed" option).
- Appearance: "As shown on screen" + Format: "Picture".
- Appearance: "As shown on screen" + Format: "Bitmap".
If you're going to paste the flowchart into a image editor to save as a standalone image file, then the best option is usually to select the "As shown on screen" + Format: "Bitmap" option.
If you're going to paste the image into another Office application, then use the "As show when printed" option. Most printers have a higher resolution than typical computer monitors, so it's often better to try this option before the "As shown on screen" option. However, it sometimes results in distorted images, in which case you could try one of the other two options.
Method 5: Copy as Bitmap, Paste back into Excel as a Picture, then Copy again
What the ...?
It may sound screwy, but if you copy an image using the Copy Picture method then paste the bitmap back into Excel, the image often comes out the sharpest. You can then copy it again using any method and paste it into the target application. I sometimes resort to this method when copying shapes that have gradient fills and/or text.
Method 6: Save Excel File as HTML and Extract the Pictures Created
[Ed: This section has been revised. I formerly recommended this method, but now I don't.]
If you have Excel 2003 or 2007 this method works fairly well, but there are two drawbacks - which I'll get to in a moment. If you have Excel 2000 or 2002 (XP), your results will depend on flow chart symbol formatting. If you use small fonts or gradient fills for the flow chart symbols, then the image created with this method may look pretty bad.
There are 2 important things to do when using this method to export a flowchart. When you click File > Save As Web Page, a Save As dialog will pop up. You probably never noticed it before, but there is a Tools dropdown in the upper right hand corner of the dialog. Click it, then click the item labeled Web Options, as shown below.
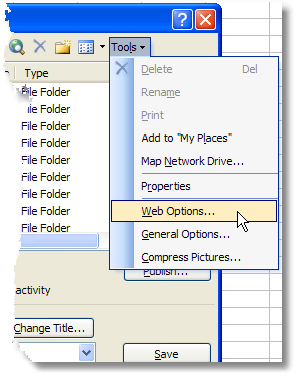
If you're using Excel 2003 or newer, the first thing you're going to want to do is click the Browsers tab and check the box allowing PNG as a graphics format. Excel 2002 and previous usually save flowcharts as GIF files and they look awful.
The second thing to do is click the Pictures tab and change the Pixels per inch setting. The pixels per inch setting is a combo box with only 3 values. Ignore these values and type in 300. Click OK and save the file as HTML. The image file will be created along with the new HTML file.
![]()
Now, the two drawbacks ... First, this article is about copying pictures, not creating HTML pages, so if a picture is all you're after, then you'll have an extra HTML file to delete.
Second, when you change the pixels per inch setting to 300, you are in effect enlarging the picture. With a 96 pixels per inch system (very common), the picture would be 300/96 = 3.125 times larger. The HTML file uses some proprietary Microsoft markup code that Internet Explorer can interpret properly and render the picture at normal size but no other browser will. The picture itself is huge and would need to be re-sized in an image editor for most uses, making this a so-so method for extracting pictures and flow charts from Excel.
Step 2 - How to Paste
Effectively Using the Paste Special Option
Pasting to an Image Editor
If you're creating a stand-alone picture file, you can simply open up your image editor (MS Paint will suffice) and paste the picture. However, When you save flowcharts, the image format can have a big effect on how the image renders. Avoid .jpg and .gif formats - especially for shapes with fill colors. For publishing to the web, your best option is to save the file as a .png file (Public Network Graphic). PNG's have excellent compression and render nicely.
Pasting to another MS Office Application
If you paste to another Microsoft Office application, such as Word or PowerPoint, you will want to paste it as an .emf (Enhanced Meta File) format picture. Without going into the technical details as to why, the reason to paste as an .emf format is because they can be re-sized and still render nicely. If you were to copy and paste the flowchart as a bitmap (.bmp) , jpeg (.jpg) or regular picture (.wmf), then tried to re-size the picture, it would become grossly distorted.
So to paste properly in Word and PowerPoint, select Edit and Paste Special from the menu. One of the dialogs show below will appear, depending whether you copied the flowchart as a picture or not. Select "Picture (Enhanced Metafile)" to paste it as an .emf.
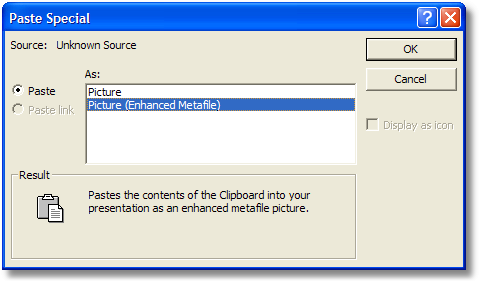
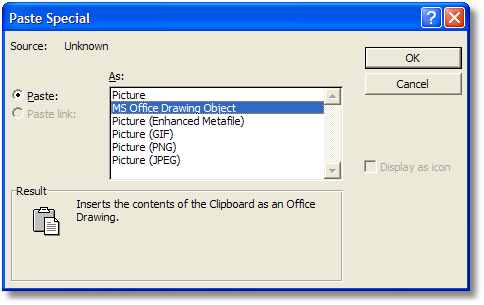
Note, selecting just plain "Picture" will paste it as a standard Windows Metafile (.wmf) format picture. WMF's are the 16-bit predecessors to EMF's, so they are smaller and render faster. But they carry less information and detail. Unless you need to view the file on Windows 3.1 or are working on a slow system, pick the Enhanced version.
Conclusion
If all this sounds like a big hassle just to copy and paste a picture, then, well, I agree. But hopefully this article has given you a few options to work with if you're not getting the results you like.
About the Author
Nicholas Hebb
Nicholas Hebb is the owner and developer of BreezeTree Software, makers of FlowBreeze Flowchart Software, a text-to-flowchart maker, and Spreadspeed, an auditing and productivity toolset for Microsoft Excel®.