Flowcharting in Excel Series
Fonts and Internal Margins in Excel Shapes
By Nicholas Hebb
Setting Flowchart Symbol Fonts and Margins
You can minimize a flowchart's footprint while maintaining readability by using fonts and AutoShape margins judiciously. When you add text to an AutoShape, Microsoft Excel creates a text frame for the text within the shape. A text frame is the largest possible rectangle that will fit within the shape. Microsoft Excel adds margins to the inside of the text frame, with the left and right margins set at 0.10" and the top and bottom internal margins set at 0.05".
If the shape is rectangular, then the text frame fills the entire shape. The margins ensure that the text doesn't butt up against the side of a shape, giving it a more aesthetic look. But, if the shape is non-rectangular, then the text frame is surrounded by white space, so the internal margins are completely unnecessary.
Also, Microsoft Excel shapes use Calibri 11pt (Excel 2000 - 2003 flowchart symbols use the Arial font). Calibri is a nice font, but in my opinion isn't as readable at small sizes as Tahoma. Tahoma 8pt has been used for years as the title bar font for Windows applications. Calibri is an OK font for readability, but tends to require larger shape sizes to accomodate the text than other fonts. If you want a little better readability at smaller fonts (e.g. 8pt), try one of Arial's more modern cousins - Tahoma or Segoe UI.
Excel Flowchart Wizard
FlowBreeze is a flowchart add-in for Microsoft Excel that makes creating flowcharts simple and pain free. Free 30-Day Trial.The Effect of Fonts and Margins on Flowchart Layout
First, it's often difficult to get a flowchart to layout on a single page. Even if the flowchart spans many pages, it's often important to get as much related content onto a page as possible, so the reader can maintain mental continuity as they look at the flowchart. [Note: this shouldn't be an excuse to cram too much on a single page and sacrifice readability. A readable multi-page flowchart is still easier to follow than a cluttered single-page flowchart.]
Second, full wording within the text often gets compromised to minimize the footprint. The danger there is that the intended message becomes incomplete or harder to understand. By maximizing the amount of text within a shape, you can get more shapes on a single page and describe each step in more detail.
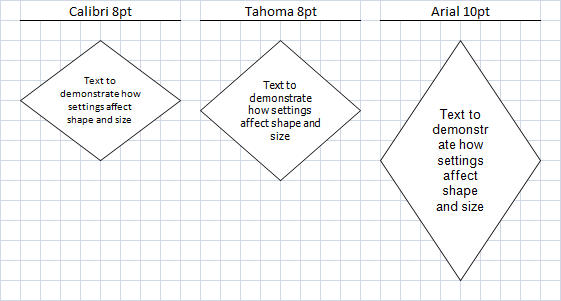
The image below shows a comparison of font sizes and internal margins. The left item emulates the Visio 2010 default of Calibri 8pt font with no internal margins. The middle item shows the FlowBreeze default of Tahoma 8pt font with no internal margins. The right image shows the Excel 2003 default of Arial 10pt with internal margins. The image below doesn't show it, but the Excel 2010 - 2019 default of Calibri 11pt actually requires more space than Arial 10pt. All three shapes have the same width, but notice the minimum height requirement for each shape.
A Legacy Note on Exporting Excel 2000 - 2003 Flowcharts to Word 2000 - 2003
If you plan on exporting the flowchart to Word 2000 - 2003, you might want to change the font to Times New Roman for consistency with the rest of the Word document. By using Times New Roman as your font, you can maintain readability while shrinking the size of the shape needed to display the text.
One note about flowchart symbols in Microsoft Word: Word sets the text formatting to the Normal style by default. On most systems, it means that the font will be set to Times New Roman 12pt. This really limits the amount of text you can get in a reasonably sized flowchart symbol. To change the default flowchart shape font in Word, add a new Style and then apply the style to the flowchart shapes. I would at least recommend reducing the point size to 10pt, shown below. (For detailed info on how to create and apply styles in Word, check your local Word help file.)
About the Author
Nicholas Hebb
Nicholas Hebb is the owner and developer of BreezeTree Software, makers of FlowBreeze Flowchart Software, a text-to-flowchart maker, and Spreadspeed, an auditing and productivity toolset for Microsoft Excel®.