Flowcharting in Excel Series
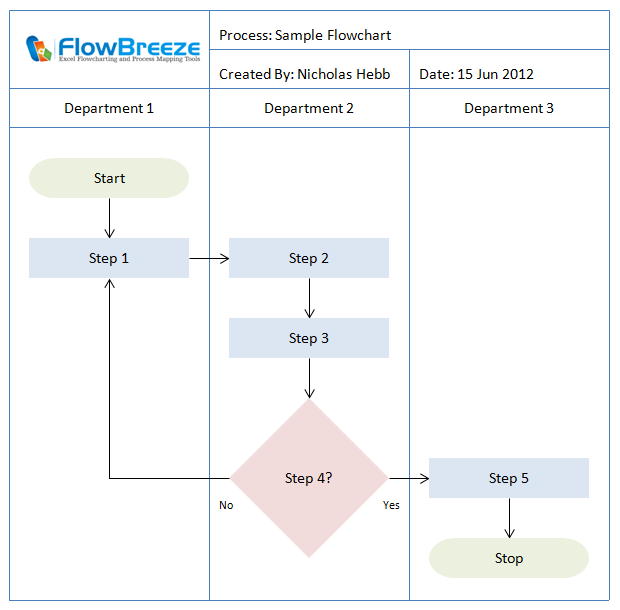
Setting Up a Flowchart Drawing Grid in Excel
By Nicholas Hebb
Here's a couple of quick tips that make flowcharting in Excel a lot easier.
Most standalone flowchart programs and diagramming tools allow the user to display a grid and snap the flowchart symbols and other shapes to the grid. This makes it easier to position and size flowchart shapes uniformly. Microsoft Excel has this capability, too, but it's not immediately apparent.
Excel Flowchart Wizard
FlowBreeze is a flowchart add-in for Microsoft Excel that makes creating flowcharts simple and pain free. Free 30-Day Trial.Use the Snap to Grid Drawing Feature
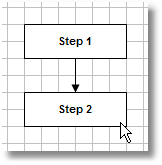
You can snap your flowchart symbols to cell borders with the Snap to Grid feature. It makes all flowchart symbols and other shapes align to the edge of a worksheet cell when you place them on the sheet, move them, or re-size them. Enabling Snap to Grid differs based on your version of Excel.
Excel 2007 - 2019
- Click the Page Layout tab.
- Click the Align dropdown menu in the Arrange group.
- Toggle the Snap to Grid button on.
Excel 2000 - 2003
- Make the Excel Drawing toolbar visible by clicking View > Toolbars > Drawing on the main menu.
- On the Drawing toolbar, click the Draw button.
- On the submenu, click Snap > To Grid.
Adjust Columns and Rows to Create Drawing Grid
Set the height and width of cells to create squares: Once you have enabled the snap-to-grid function, you'll want a tighter grid for flowcharting. For most flowchart drawings, the default column width and row height will work just fine. But for more control over the layout of your flowchart, try setting the column width to 1.71. This will make the columns 17 pixels high - matching the standard row height (i.e., a standard row height of 12.75 = 17 pixels). [See the Excel Trivia below if you're confused about row height vs. column width units.]
If you don't know how to adjust the column width, follow these steps:
-
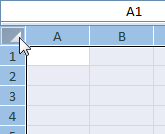
Click on the top-left corner of the worksheet to select all the cells:
-
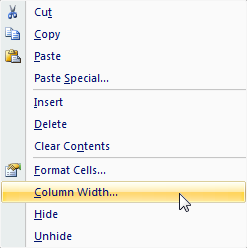
Right-click on any column and this popup menu will appear. Click on Column Width ...
-
Set the column width according to your Excel version:
-
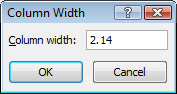
Excel 2007 - 2019: Set the column width to 2.14 (assuming you're using the default Office theme.)
-
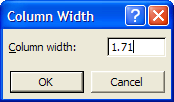
Excel 2000 - 2003: Set the column width to 1.71.
-
Excel 2007 - 2019: Set the column width to 2.14 (assuming you're using the default Office theme.)
Now that you have the Snap to Grid function enabled and the worksheet cell size set to a nice, tight grid, you can easily create flowcharts with well-aligned layouts and uniform flowchart symbol sizes. Best of all, you can avoid those ugly jagged flow lines that result from unaligned flowchart shapes.
Excel Trivia
Q: Do you know what column-width units are? (hint: It's not points, pixels, or any of the other standard screen measurements.)
A: It's the average number of characters that will fit in the cell when you use the standard font. So the standard column width of 8.43 will hold about 8 characters in a cell.
Q: OK, so what are the row-height units then?
A: Points (pts), where 72pts = 1 inch. (Newer versions of Excel also display the pixels.)
About the Author
Nicholas Hebb
Nicholas Hebb is the owner and developer of BreezeTree Software, makers of FlowBreeze Flowchart Software, a text-to-flowchart maker, and Spreadspeed, an auditing and productivity toolset for Microsoft Excel®.