Flowchart Tutorial
How to Flowchart in PowerPoint 2007, 2010, 2013, 2016, and 2019
By Nicholas Hebb
Preliminaries
Overview
This tutorial gives a general overview of the Drawing tools in PowerPoint and tries to point out some tips that may not be so obvious. If you have used the tools in other office applications, the basic concepts are the same, but each Office app has its own twists. (NB: We make FlowBreeze, an add-in that automates making flowcharts in Excel.) Also, it should be noted that this article covers the classic Microsoft Office shapes, a.k.a. autoshapes, not the SmartArt Graphics. SmartArt is attractive and is good for certain diagram types, but it is not really suitable for creating flowcharts.
Excel Flowchart Wizard
FlowBreeze is a flowchart add-in for Microsoft Excel that makes creating flowcharts simple and pain free. Free 30-Day Trial.The drawing tools from 2007 through 2019 are the same with only minor differences. PowerPoint 2010 added guides that show up when moving a shape into alignment with another shape. PowerPoint 2013 - 2019 have slightly different stylings for the default themes in the Quick Styles than the previous versions. Otherwise, creating flowcharts and other diagrams is the same among versions.
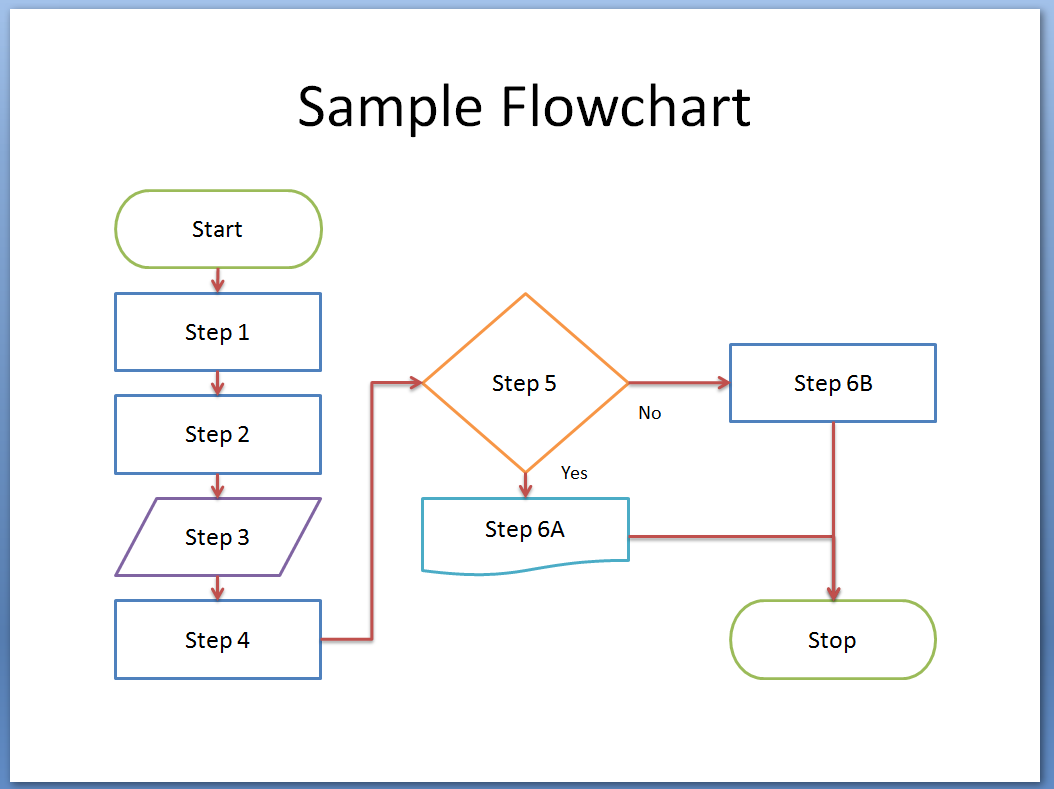
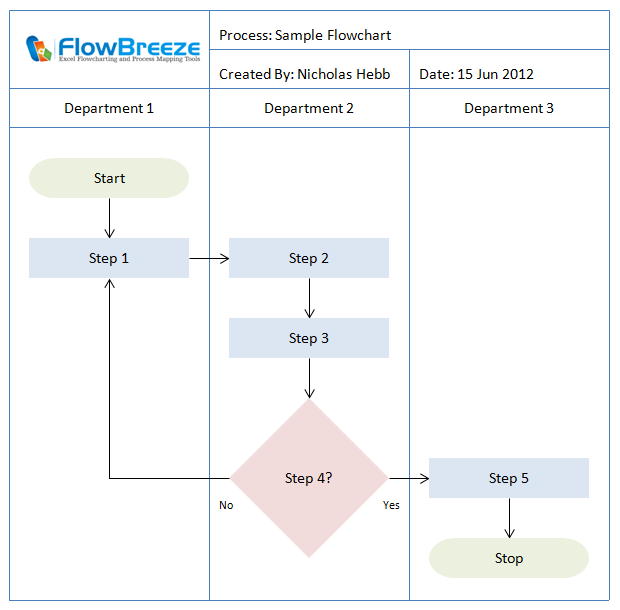
Simple PowerPoint Flowchart
Slide Types
Before starting, you need to select the correct slide type for a flowchart. Click the New Slide dropdown from the Home tab, and select Title Only or Blank slide to maximize space. You may be tempted to select the Title and Content slide, but the content panel is not designed for adding standard shapes.
Set Grid Options
By default, shapes will snap to a grid in PowerPoint. The grid size units are dependent upon localization. In the U.S., the standard dimensions are in inches, and the display grid is 1". Not shown are the snap grid points. When you move or resize a shape, the edge will "snap" to the nearest grid point. The default snap grid spacing is set to 0.083" (1/12"). If you want to change the snap grid spacing, on the PowerPoint Home tab click Arrange > Align > Grid Settings to open the Grid and Guides dialog.
The key settings on the Grid and Guides dialog are as follows:
- Snap objects to grid: If checked, shapes will snap to the grid when they are added, moved, or resized.
- Snap objects to other objects: This setting is would only be useful if you had shapes that were not aligned to a grid and you wanted to snap to them.
- Spacing: Dropdown to select grid spacing presets.
- Display grid on screen: This displays the 1 inch grid, not the snap grid points that you might expect.
- Display drawing guides on screen: A fairly useless setting that will display a vertical and horizontal line (forming a cross) through the center of the slide.
- Set as Default (button): Honestly, I have no idea what this does. Whether pressed or not, the settings on this form affect all slides.
Creating the Flowchart
Insert Shapes
The flowchart shapes are available from both the Drawing group on the Home tab and on the Insert tab under the Shapes dropdown gallery. Since the Home tab is more convenient, we'll just use that. To view all the shapes in the gallery, click the More down arrow as shown in the image, below left. The full gallery is shown below on the right. The screenshots below are PowerPoint 2013, but the shapes tools have remained fairly consistent from Office 2007 through 2019.
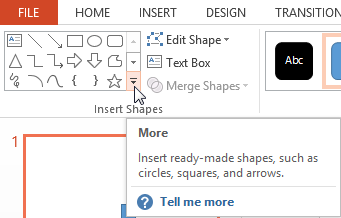
Click More to expand shapes gallery
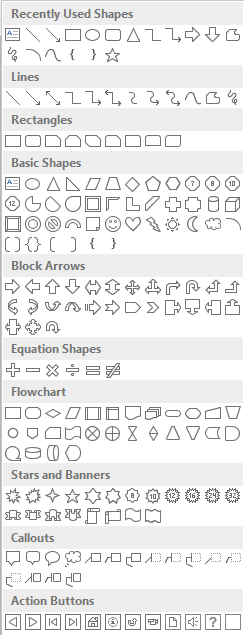
Full shapes gallery
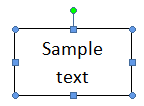
To add a shape, click on the shape in the gallery and then click anywhere on the slide to place the shape. You can also draw it onto the slide by holding and dragging the left mouse button. After the shape is placed, you can move and resize it with your mouse as needed. To add text, click on the shape and start typing. The default text alignment is centered vertically and horizontally. The horizontal alignment can be changed using the standard text alignment buttons in the Paragrapgh group of the Home tab. The vertical alignment settings are available via the Align Text dropdown.
Related article: Flowchart symbols and their meanings.
Add Connector Arrows
Adding arrow connectors works similarly to adding a shape. From the shapes gallery, select the arrow type and use the left mouse button to draw the arrow. They're called "connectors" because the arrow end points connect to the shapes. If the shape is moved, the connector moves with it. To connect an end point to a shape, click and drag the end point to the shape until you see the connection points highlighted on the shape and the connector snaps to the desired connection point.
There are 3 types of lines - straight, elbow, and curved. You can right-click on a connector to change it from the Connector Types menu.
Add Labels
For branches coming out of Decision shapes or parallel paths, you can add labels next to the connector lines. For these, you should use the borderless Text Box available on the Insert tab to differentiate it from the other flowchart process shapes. The standard font size for labels is 18pt, but for these I personally reduce the size to 16pt or 14pt to help visually set them apart from the other shapes.
Formatting Shapes
Using the Quick Styles
The style gallery is available in two places. On the Home tab, the Quick Styles dropdown gallery is enabled when you click on a shape. Also, when you click on a shape a Format tab becomes visible on the ribbon. The style gallery available in both places is the same, but the format tab gives you more options for customization, which we cover below.
PowerPoint 2007 - 2010 Shape Style Gallery
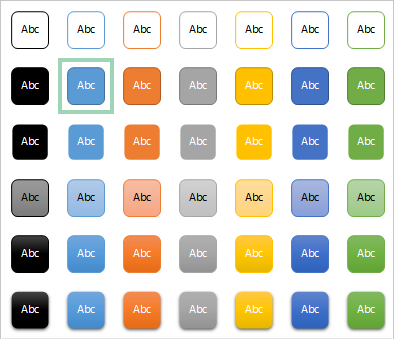
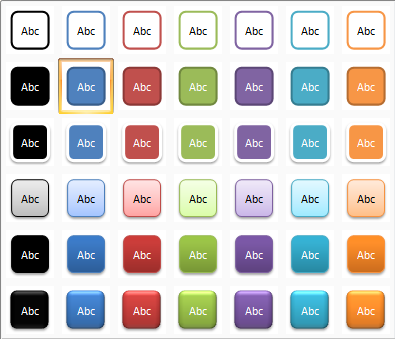
PowerPoint 2013 - 2019 Shape Style Gallery
(a few more styles were added in PP 2016)
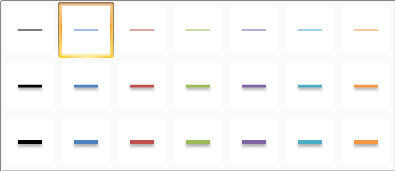
PowerPoint 2007 - 2010 Line Style Gallery
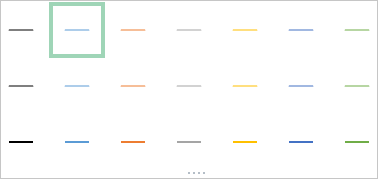
PowerPoint 2013 - 2019 Line Style Gallery
Default Style
When you first add a shape, the default style in PowerPoint 2007 and 2010 is a dark blue background with white text. PowerPoint 2013 - 2019 have a much nicer light blue fill color. After you add the first shape, you can use the Quick Styles to change the formatting and change the font type, size and color to suit your taste. Then right-click on the shape and select Set as Default Shape from the context menu. (The menu label is somewhat misleading. It sets the default shape style, not the shape type.) The behavior is Now when you add new shapes the formatting will be preset to the new default style.
Font Choice
The standard font in PowerPoint is Calibri 18pt. Needless to say, this will not allow many shapes to fit within a single slide. It may be tempting to reduce the font size to get more on the page, but remember that this is presentation software. Small flowchart text may be very hard to read for your audience. Most presentation pros advise never to go below 16pt for the text and 14pt for labels.
To reduce the size of your flowchart, be terse with your text and aim for a high level overview of the process, not a detail-oriented one. Also, avoid Decision shapes (diamonds) because they take a large footprint and hold a smaller amount of text than other shapes the same size. For some shapes, such as Decisions, you can get more text into the shape by setting the internal margins of one or more sides to 0. To change the internal margins, right-click on the shape and select Format Shape from the menu.
- In PowerPoint 2007 and 2010, a Format Shape dialog opens. Select the Text Box category to change the internal margins.
- In PowerPoint 2013 - 2019, a Format Shape side panel displays on the screen. Click Text Options, then clcik the text box icon to access the internal margin settings.
Setting Custom Styles
The custom formatting tools are located on the Format tab that becomes visible when a shape is selected. The ones of interest to flowcharts are:
- Shape Fill: Custom fill colors and gradients.
- Shape Outlines: Line color, dashes, and weight (thickness) of the shape border.
- Shape Effects: Drop shadows and other special stylings. Think of your audience and show some restraint.
- Edit Shape > Change Shape: Allows you to change the type of the selected shape, e.g. from a process (rectangle) shape to a decision (diamond). Any arrows connected to the changed shape will become unconnected.
Note: The following screenshots are from PowerPoint 2007, and new styles were introduced in PowerPoint 2013. However, the ribbon layout has remained consistent.
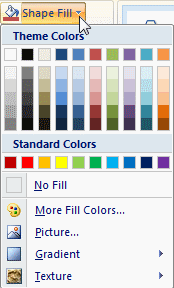
Shape Fill
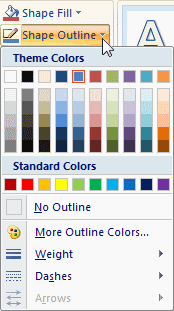
Shape Outline
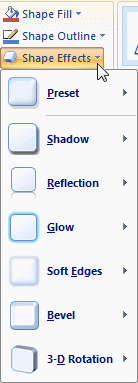
Shape Effects
To access more formatting features, right-click on a shape and select Format Shape from the popup menu.
Formatting Tips
If you change the Theme on the Design tab, all stylings may be changed.
Formatting shapes and connectors individually is a pain. Instead, wait until you have completed the diagram and format everything at once. You can select multiple shapes and format them together. Shapes and connectors should be done separately because the Quick Styles gallery is different for each.
You can select a shape and use the Format Painter tool on the Home tab to quickly copy and paste a style from one shape to another. If pasting to multiple shapes, make sure to double-click the Format Painter toolbar button instead of single-clicking it.
Manipulating The Drawing Objects
Selecting Multiple Shapes
There are several methods to select multiple shapes:
- Click on the first shape, hold the Shift key down, and click on the other shapes.
- Click and drag your mouse around all the shapes you want to select.
- On the Home tab, click Arrange > Selection Pane. This opens a sidebar that allows multiple selections by holding the Ctrl key. However, it list the shapes by their generated names, not by their text, so it's not immediately obvious which shapes you are selecting.
Ordering, Grouping, Aligning, and Rotating Shapes
- Ordering: Bring to Front and Send to Back will set the order of overlapping shapes.
- Grouping: Grouping a set of selcted shapes will allow you to treat the group as a single shape. Ungrouping splits the grouped items back to their original state.
- Aligning: The align sub-menu lists a number of tools for aligning multiple shapes to center, top, bottom - relative to the first shape selected. If you have the Align to Slide option checked, all the shapes will align to the slide instead of to each other, which is particularly useful if you want to center the diagram on the slide - but make sure to group all the shapes before doing so.
- Rotate: This will rotate the shape and the text within it. Rotating a shape or flipping it vertically will rotate the text, but flipping it horizontally will not.
Resizing Shapes
 When you select a shape, resize "handles" appear on the sides and corners. Click and drag a handle to adjust the size. You can also right-click on the shape and select Size and Position from the popup menu. This dialog allows finer control over the height, width, and rotation.
Moving Shapes
There are 3 ways to move a shape:
- Click and drag the shape with the mouse.
- Click the shape to select it, and then use the keyboard arrow keys to move it. It will snap to grid as it is moved.
- Same as #2, but hold the Ctrl key down. This will nudge the shape in fine increments and will not snap to grid.
About the Author
Nicholas Hebb
Nicholas Hebb is the owner and developer of BreezeTree Software, makers of FlowBreeze Flowchart Software, a text-to-flowchart maker, and Spreadspeed, an auditing and productivity toolset for Microsoft Excel®.