Excel Drawing Tutorial
How to Create a Nassi-Shneiderman Diagram in Excel
By Nicholas Hebb
Occasionally I get asked in FlowBreeze can create Nassi-Shneiderman diagrams. Short answer: No. However, you can make them using the built-in shapes and drawing tools in Excel. there are free tools available online, but if you already have Microsoft Excel, then hopefully this short tutorial will save you from having to download and install some specialized software.
Excel Flowchart Wizard
FlowBreeze is a flowchart add-in for Microsoft Excel that makes creating flowcharts simple and pain free. Free 30-Day Trial.What is a Nassi-Shneiderman Diagram?
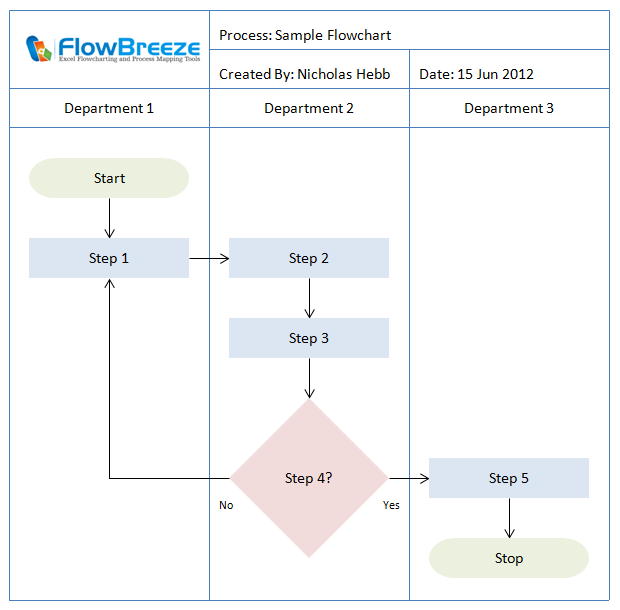
Nassi-Shneiderman diagrams (aka, NS diagrams or structograms), are used to outline structured programs. They are not very common in industry today but are sometimes used as a computer science teaching tool, often as an alternate to flowcharts. A simple example is shown below.
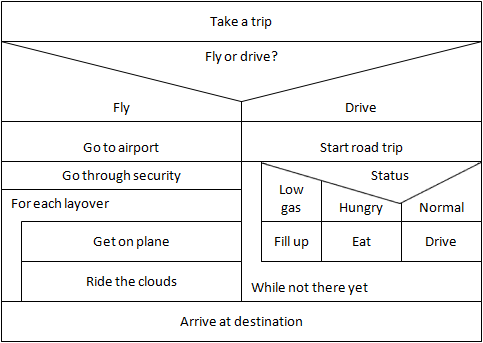
Sample Nassi-Shneiderman diagram
Nassi-Shneiderman Shapes
Process
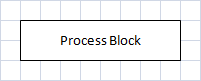
Any statement that is not
a branch or loop.
Branches
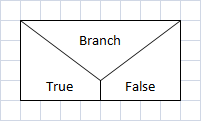
Binary branch statement,
such as an if statement
with a true/false choice.
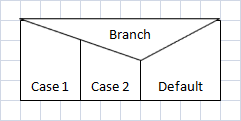
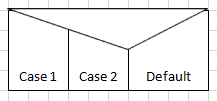
Multiple branches,
such as a switch-case statement.
Default case is the short leg of the triangle.
Loops
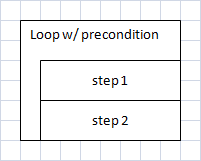
Loop with precondition,
such as a for loop or a while loop
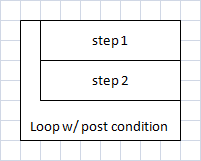
Loop with postcondition,
such as a do-while loop.
Steps to Make a Nassi-Shneiderman Diagram in Excel
Adding a bunch of shapes to the diagram is fairly straightforward. (Well, except for the Branch triangle, which is a pain. We'll show why below.) Since the default shape style in Excel is dark blue with centered text, we will create some baseline shapes with plain styling that we place off to the side and then copy and paste to build the diagram.
Create a Grid
Before adding shapes, the first step is to create a grid and then turn on Snap to Grid. These steps are covered in the How to Flowchart in Excel article, so we won't repeat them here.
Create a Baseline Process Block
Click the Insert tab, then click the Shapes dropdown and select either a Rectangle from the Basic Shapes group or a Process shape from the Flowchart group. Use you left mouse button to draw it to size on the sheet. With the shape still selected, right-click on the shape and select Format Shape from the context menu. Follow these steps to set the styling:
- On the Format Shape dialog, select Fill from the left menu. Choose the Solid fill option and use the Color dropdown to set the color to white.
- Next, select Line Color from the left menu. Choose the Solid line option and use the Color dropdown to set the color to black.
- Next, select Line Style from the left menu. Change the Width setting to 0.75 pt.
- Click the Close button
- Type "text" (or some othert placeholder text) into the shape.
- With the shape still selected, click the Home tab, and use the font, font size, and font color toolbar controls to set the font as desired.
- Right-click on the shape again and select Set as Default Shape from the menu. Despite the misleading menu label, this sets the default style, not the default shape type. Now all shapes added will use this
Create a Baseline Branch Shape (Triangle)
There are several triangle shapes available in Excel, but the only one that is suitable is the Isoceles Triangle under the Basic Shapes group. It has an adjustment handle (covered below in Adjusting Branch Shapes) that lets you move the center vertex for making switch branches. There is one problem, though. It points upward, and if we rotate the shape, then any text will be upside down. So what we will do is to create a branch shape and use a borderless, transparent textbox on top of that.
Triangle:
- Add the Isoceles triangle as you did the process rectangle before.
- Next, right-click on the triangle and select Size and Properties from the menu.
- On the size dialog, change the Rotation to 180°.
Textbox:
- Add a textbox shape to the sheet. (Icon:
 )
) - Add some placeholder text to the textbox.
- Set the position and the size of the textbox to be on top of the triangle (see the Editing Tips section below).
Grouping the Triangle and Textbox:
Grouping shapes together lets you treat multiple shapes as a single object, which is how we will want to use our contrived branch block.
- Click on the textbox to select it.
- Hold the shift key and click on the triangle so both shapes are selected.
- Right-click on a line of either shape and select Grouping > Group from the menu.
Final Edit:
Once shapes are grouped you can select individual shapes within the group by first clicking on the group to select it, and then clicking again on the individual shape. Do this now to select the textbox. Right-click on the textbox and use the Format Shape dialog to change the Fill to None and the Line Color to No line. You now have a reusable branch element.
Add Shapes to the Diagram
Now that we have created the base shapes, creating the diagram is just a matter of copying and pasting the baseline shapes. Of course, you will need to position and size the shapes as you build the diagram. You will also need to set the z-order* of the triangles and adjust their vertices so that the branch statements are properly positioned on top of the process blocks, which are both covered below in the Editing tips section.
* Z-order is the front to back positioning. When shapes overlap, it determines which shape is on top.
Editing Tips
Adjusting Branch Shapes
In Excel, shapes that can be altered display yellow "adjustment handles" at the adjustment points. You can click and drag these points to change the shape of the shape, so to speak.
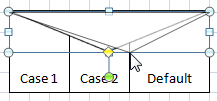
Triangle adjustment
Adjustment results
Changing The Z-Order (Stacking Order)
When dealing with branches and loop tests, it is often necessary to change the z-order stacking of a shape by bringing it forward or sending it backward. The easiest way to do this is to right click on a shape and use Bring to Front or Send to Back from the context menu. But the following keyboard shortcuts are useful when a shape is hard to select with a mouse.
- Alt + P A E K - Send to Back: Places the shape underneath all other shapes.
- Alt + P A E B - Send Backward: Sends the shape one layer down.
- Alt + P A F R - Bring to Front: Places the shape on top of all other shapes.
- Alt + P A F F - Bring Forward: Brings the shape one layer up.
The multi-key shortcuts look odd compared to most keyboard shortcuts, but when you hold the Alt key, Excel hightlights them on the screen making the path becomes obvious. The letters map to characters in each word, even though they are not underlined like menu systems. For example, Send to Back is Page Layout > Arrange > Send Backward > Send to Back.
Selecting Shapes
You can select shapes with your mouse and use the Tab key to toggle between selected shapes. To select multiple shapes, click the first shape and then hold the Shift key down as you click on the others. You can also use a special Select Objects cursor available on the Home tab under the Find & Select menu. You need to toggle this cursor off to resume normal mouse usage - via the menu or by double-clicking anywhere on the worksheet.
Moving Shapes
Clicking and dragging with the mouse is the most obvious way, but you can also use the keyboard arrow keys to move a shape around. With Snap to Grid on, shapes will snap to the next cell as you do this.
Changing Text Alignment
On the Home tab, use the standard horizontal and vertical text alignment buttons.
Hiding the Excel Gridlines
On the View tab, uncheck the Gridlines checkbox.
Saving To Non-Excel Formats
Starting with Excel 2007, copy operations place an image of the copied range onto the Windows clipboard. To save the diagram as an image, select the cells fully encompassing the diagram, copy, and then paste into an image editor (even MS Paint will suffice). Alternately, you can paste into Word. I recommend doing a Paste Special and choosing the Enhanced Metafile format. Metafiles are like vector graphics in that when you resize the image, the lines and text will still render nicely.
Lastly, you can save to PDF. Excel has some problems when saving shapes to PDF. I recommend that you read the How to Save Excel Flowcharts to PDF article
About the Author
Nicholas Hebb
Nicholas Hebb is the owner and developer of BreezeTree Software, makers of FlowBreeze Flowchart Software, a text-to-flowchart maker, and Spreadspeed, an auditing and productivity toolset for Microsoft Excel®.