What is a Flow Chart?
By Nicholas Hebb
Flow Chart Defined
A flow chart is a graphical or symbolic representation of a process. Each step in the process is represented by a different symbol and contains a short description of the process step. The flow chart symbols are linked together with arrows showing the process flow direction.
Excel Flowchart Wizard
FlowBreeze is a flowchart add-in for Microsoft Excel that makes creating flowcharts simple and pain free. Free 30-Day Trial.Common Flowchart Symbols
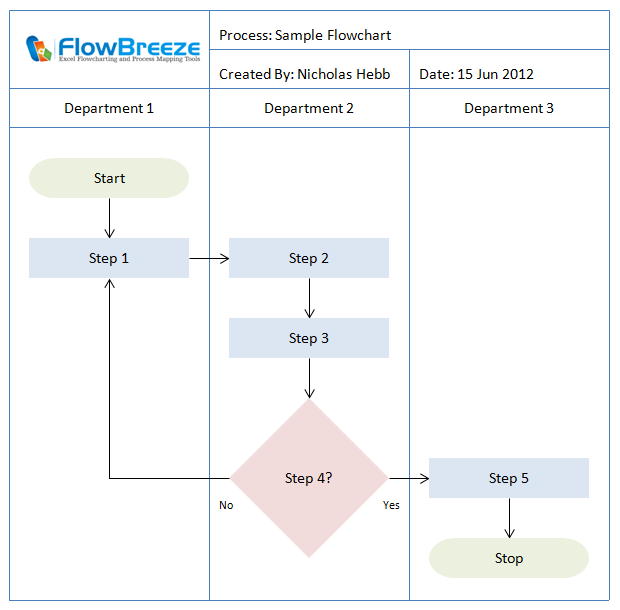
Different flow chart symbols have different meanings. The most common flow chart symbols are:
- Terminator: An oval flow chart shape indicating the start or end of the process.
- Process: A rectangular flow chart shape indicating a normal process flow step.
- Decision: A diamond flow chart shape indication a branch in the process flow.
- Connector: A small, labeled, circular flow chart shape used to indicate a jump in the process flow. (Shown as the circle with the letter "A", below.)
- Data: A parallelogram that indicates data input or output (I/O) for a process.
- Document: Used to indicate a document or report (see image in sample flow chart below).
(A complete list of flow chart symbols can be found in the flowchart symbol definitions article.)
A simple flow chart showing the symbols described above can be seen below:

Three Alternative Definitions of Flow Chart
The above definition is correct, but it falls short of describing the coolness of flow charts.
Q: Did you just say "the coolness of flow charts"?
A: Yes, I did.
I know that sounds a little ridiculous, but in my years as a manufacturing engineer, flow charts and Pareto charts were my two favorite tools for characterizing and improving processes. As such, I learned to appreciate the different ways that you can use them.
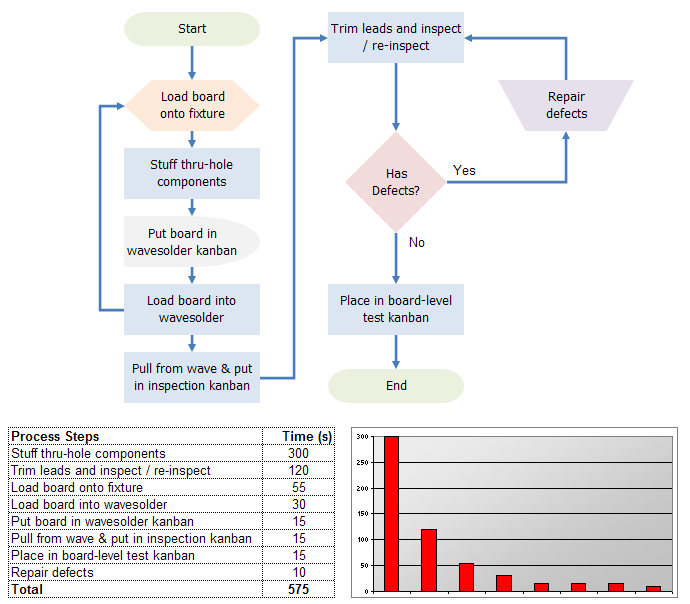
As-Is Flowchart
The first cool thing about flow charts is that they let you see the process flow at a glance, so my first alternative definition of "Flow Chart" is a Snap Shot of your Business Processes . This is commonly called an As-Is Flowchart. You can tell a lot about the complexity (and often over-complexity) of many business processes just by looking at an as-is flow chart of them - without even reading the text in the symbols. You can easily see the flow of information and materials, branches in the process, opportunities for infinite loops, the number of process steps, inter-departmental operations, and more.
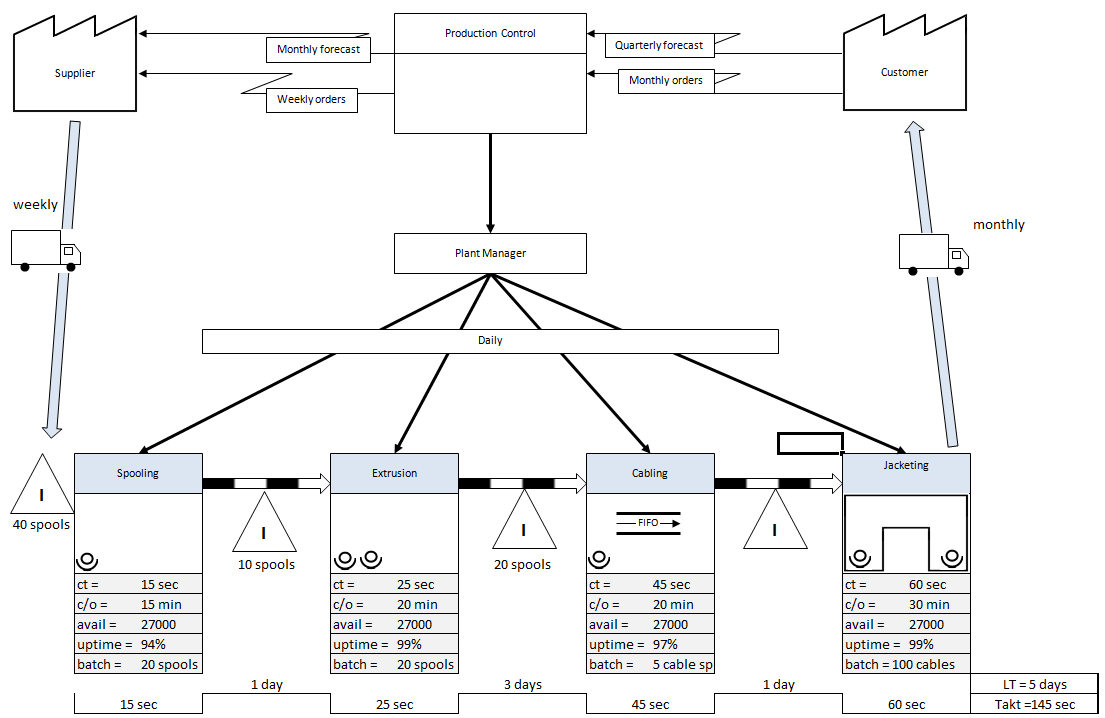
Process Zoom Lens
The second cool thing about flow charts is that they let you see the process flow at different levels, so my second alternative definition of Flow Chart is a Zoom Lens for your Business Processes . Flow charts are often categorized in 3 levels: high-level, mid-level and low-level (detailed). A high-level flow chart could be a process defined at the company-wide or large-system level. A mid-level flow chart could be a process defined at the department level, and a low-level flow chart could be a process defined at working level.
For example, I used to run a test department. Product validation was a process step included in a high-level flow chart in the New Product Introduction procedure. The validation test process itself was documented in a mid-level flow chart showing the general department activities required to support qualification testing. Drilling down, some of the ISO 9000 work instructions for individual test types had low-level, detailed flow charts documenting how to conduct each test.
Some flow chart tools (including Microsoft Excel) allow you to add hyperlinks to flow chart symbols. The hyperlinks let you click on a flow chart symbol, drilling down from a high-level process step to a detailed set of process flow steps. This truly gives you the zoom lens capability.
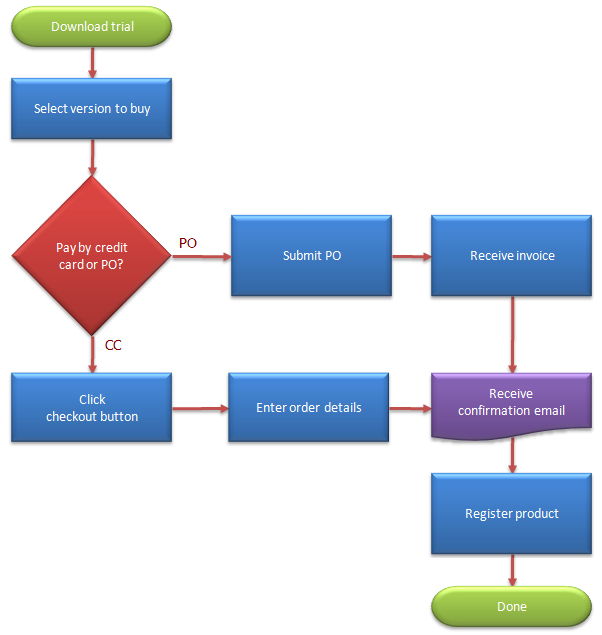
Process Test Bed
The third cool thing about flow charts is that they let you perform risk-free experiments, so with that in mind my third and final alternative definition of Flow Chart is a Process Test Bed. All process improvements require change, and most changes involve risk, require work, cost money, or instill some level of emotional uncertainty and fear. You can mitigate each of these by creating flow charts of any proposed operational changes. Each flow chart can be a "what-if" that helps the involved players more easily see the risks involved. Personally, I do before and after flow charts on all significant process changes.
Other Names for "Flow Chart"
Unfortunately, the world of flowcharting hasn't come to a unanimous agreement on what to call flow charts. Common alternative names include: flowchart, process flow chart, process map, process chart, process model, process flow diagram, or just flow diagram. Quite frankly, all the variations get a little annoying. I prefer "flowchart" but use "flow chart" and other terms extensively because that's what people commonly search for online.
A big annoyance is terms that have different meanings based on context. For instance, the term "Process Map" often refers to flow charts that assign attribute data - inputs and outputs - to each process step. But "Process map" is also used to refer to flow charts that map the interrelationships between top level procedures in an ISO 9000 system. And, I have a book about "Process Mapping" that contains nothing but traditional flow charts.
Flow Diagram is often synonymous with Data Flow Diagram - a graphical representation of the information flow in a computer program. I've seen the term misused to mean standard flow charts as well. Business Process Model Notation (BPMN) is a more technical type of diagram and should not be used synonymously with flow chart. Lastly, Activity Diagrams, which are used in UML modeling, are basically just flow charts, but they are used in conjunction with other types of diagrams that depict software design and usage.
About the Author
Nicholas Hebb
Nicholas Hebb is the owner and developer of BreezeTree Software, makers of FlowBreeze Flowchart Software, a text-to-flowchart maker, and Spreadspeed, an auditing and productivity toolset for Microsoft Excel®.