FlowBreeze Feature Spotlight:
Value Stream Mapping Tools
FlowBreeze makes it easy to create Value Stream Maps to model the material and information flow through a process. Excel is a perfect environment for creating value stream maps because it allows you to summarize and analyze the process metrics in the same environment that you create the diagram. Plus, Excel is an environment that many people are already familiar with.
FlowBreeze offers two tools that make creating value stream maps a snap:
- Value Stream Mapping Template Generator: Kickstart VSM diagrams pre-loaded with common symbols.
- VSM Symbols Task Pane: Click-to-add symbols via a handy Excel side panel.
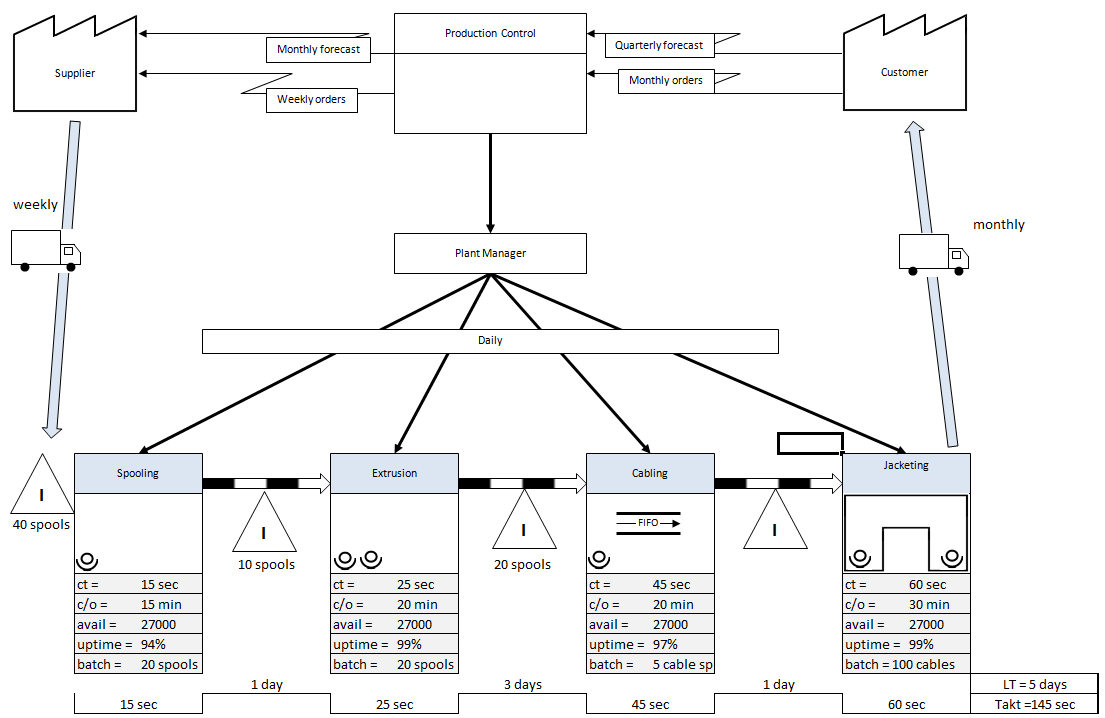
Simple Present State VSM Sample
Value Stream Mapping Template Generator
Much like the FlowBreeze template designer for flowcharts, the value stream mapping template generator lets you create re-usable Excel templates to speed up the process of making diagrams. It allows you to create a standard title block (including logo, if needed), and a basic outline of the value stream.
It includes preset Customer, Supplier, and Production Control symbols. Additionally, you can specify how many Process symbols you want, and include a Data Table and Timeline below each Process. And, of course, since they are Excel template files, you can modify the template with additional symbols as needed, so you don't end up reinventing the wheel everytime you need to create a value stream map.
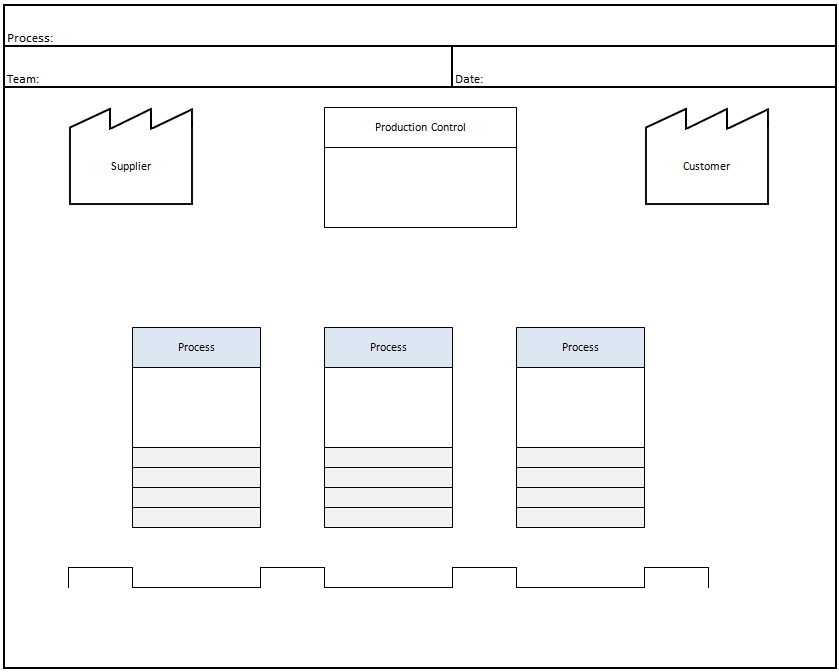
Value Stream Mapping Template Example
VSM Symbols Task Pane
The Value Stream Mapping symbols are accessed via the VSM Symbols Task Pane - a panel the opens on the left side of Excel worksheet. You simply select the symbol and click a button and the symbol will be added the worksheet in the cell you have selected. Plus, the task pane has optional data entry fields for many symbol types (e.g. title and text fields for Process symbols) for added convenience.
The image to the right shows a snap shot of how the VSM Symbols Task Pane is used in Excel.
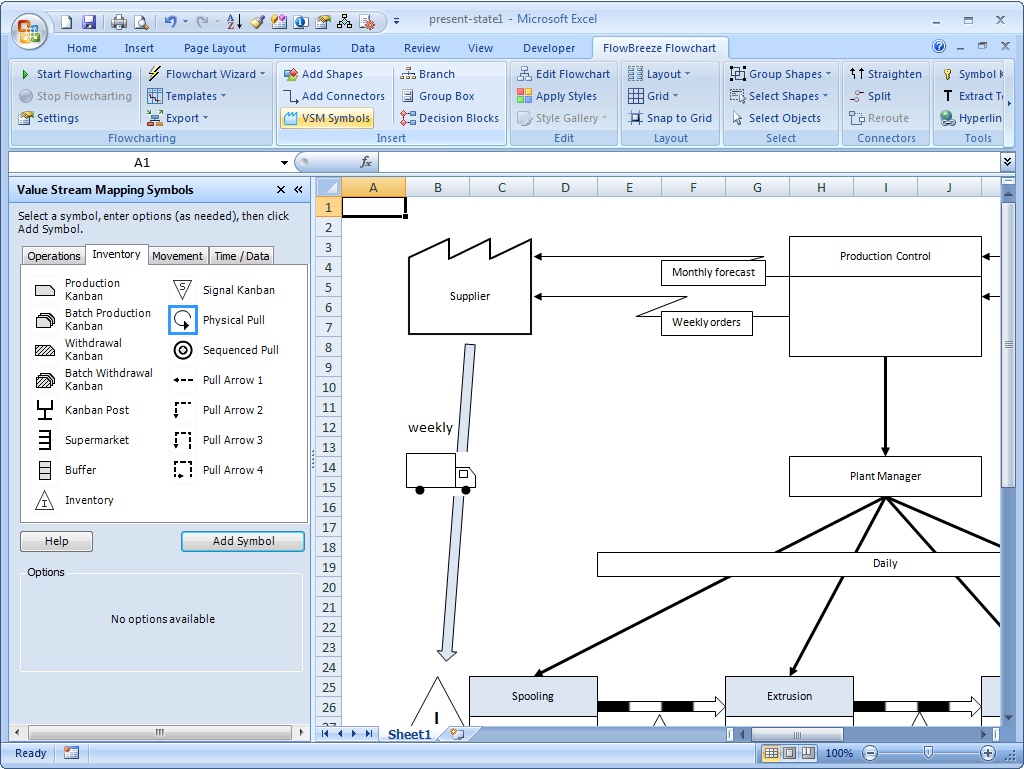
Value Stream Mapping Task Pane
Value Stream Mapping Symbols
The listing below shows all the symbols available in the task pane. The symbols are organized in functional groupings - Operations, Inventory, (Material) Movement, and Time / Data.
Operations Symbols
 - Process - Process |
 - U-Cell - U-Cell |
 - Operator - Operator |
 - Factory (Customer / Supplier) - Factory (Customer / Supplier) |
 - Production Control - Production Control |
 - Schedule - Schedule |
 - Go See - Go See |
 - FIFO lane - FIFO lane |
 - Load Leveling - Load Leveling |
 - Kaizen Burst - Kaizen Burst |
 - Electronic Information - Electronic Information |
Inventory Symbols
 - Production Kanban - Production Kanban |
 - Batch Production Kanban - Batch Production Kanban |
 - Withdrawal Kanban - Withdrawal Kanban |
 - Batch Withdrawal Kanban - Batch Withdrawal Kanban |
 - Supermarket - Supermarket |
 - Buffer - Buffer |
 - Inventory - Inventory |
 - Signal Kanban - Signal Kanban |
 - Kanban Post - Kanban Post |
 - Physical Pull - Physical Pull |
 - Sequenced Pull - Sequenced Pull |
Material Movement Symbols
 - Truck - Truck |
 - Forklift - Forklift |
 - Airplane - Airplane |
 - Boat - Boat |
Timelines and Data Table Formatting
 - Non Value-Added Time - Non Value-Added Time |
 - Value Added Time - Value Added Time |
 - Timeline Total - Timeline Total |
 - Data Table - Data Table |
The Value Stream Mapping tools are just one set of features in FlowBreeze. Download a free trial to start mapping your value streams today.