Flowchart Tutorial
Cross Functional Flowcharts
By Nicholas Hebb
What Is A Cross Functional Flowchart?
A basic flowchart consists of a series of process steps connected by arrows showing the order of operations. In that regard flowcharts are one dimensional. Cross functional flowcharts use swim lanes to provide an extra dimension by assigning each process step to a category. Most often the category is a stakeholder (person, role, or department), but it can also be a machine, a project phase, a resource, or some other attribute.
Excel Flowchart Wizard
FlowBreeze is a flowchart add-in for Microsoft Excel that makes creating flowcharts simple and pain free. Free 30-Day Trial.How To Create Swim Lanes
The (hopefully) obvious first step is to determine how many lanes you want to represent and what the lane titles will be. Some flowchart software, such as Visio, has built-in templates for creating swim lanes that allow you to add or remove lanes. Here at BreezeTree, we use excel for flowcharts. In Excel, an easy way to create the lanes is to add a set of process rectangles and vertical lines, and then group them all together. With FlowBreeze, we make that even easier by including a template generator for making swim lanes.
You also need to decide the layout of the diagram - both page orientation and lane direction. Business process analysts often prefer a landscape orientation with a left to right flow of process steps. When creating a flowchart to be included in process documentation, e.g. company procedures or work instructions, portrait orientation with top to bottom flow is also common. The choice of vertical or horizontal swim lanes comes down to personal choice or just plain "what fits best".
Cross-functional Flowchart Templates:
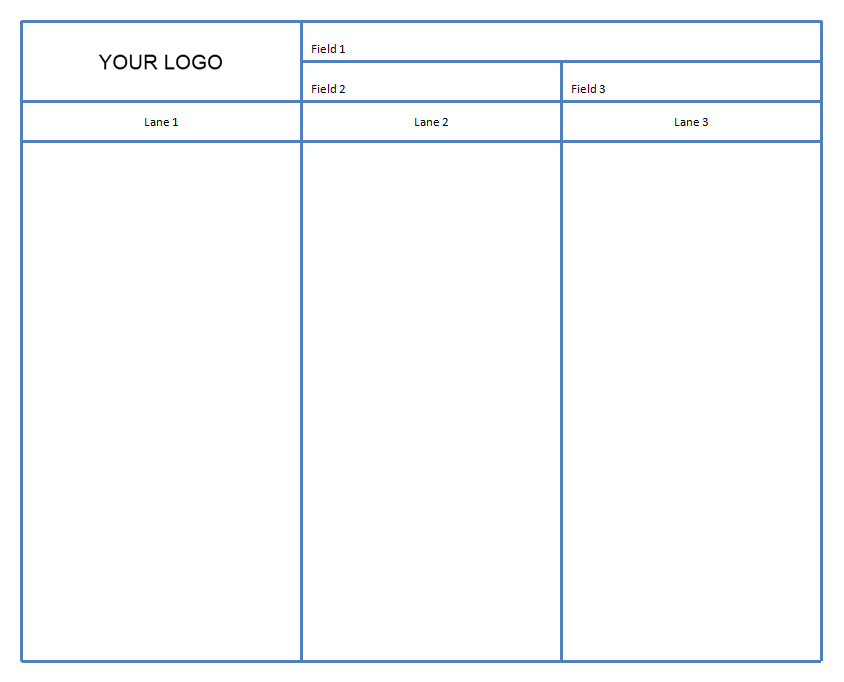
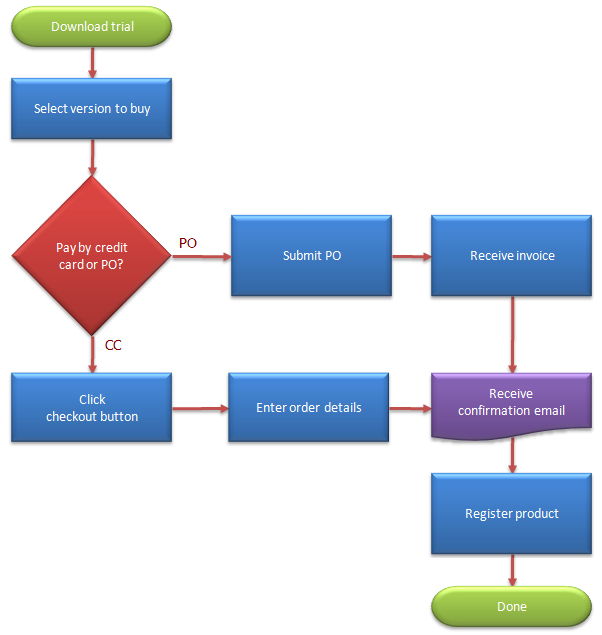
Vertical swim lanes
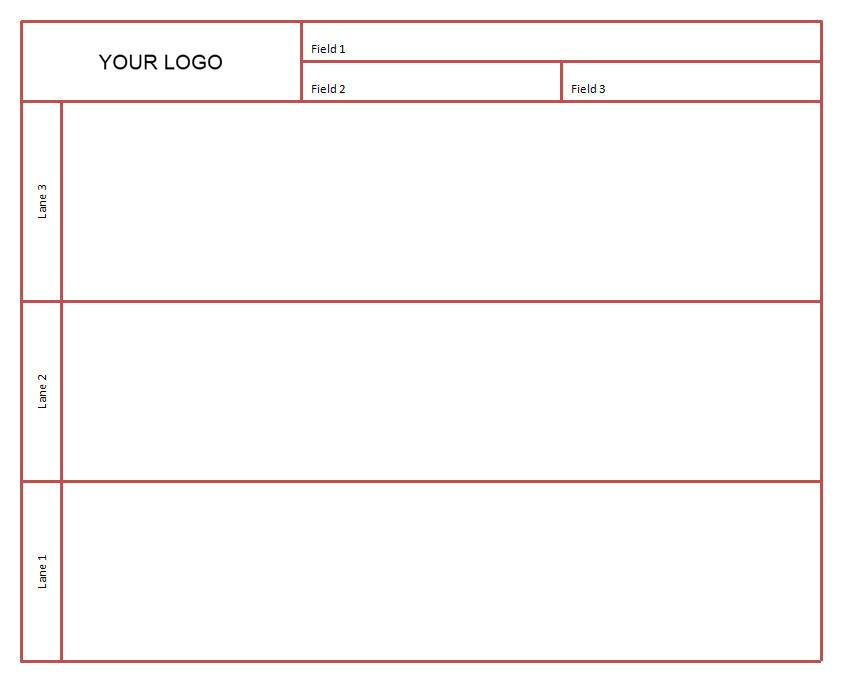
Horizontal swim lanes
Once the lanes are created, the process steps are added to the appropriate lanes as you make the flowchart. When laying out the steps, it is important to avoid a lot of criss-crossing of the flow lines (a.k.a., sequence arrows, connectors).
Common Uses For Swim Lanes
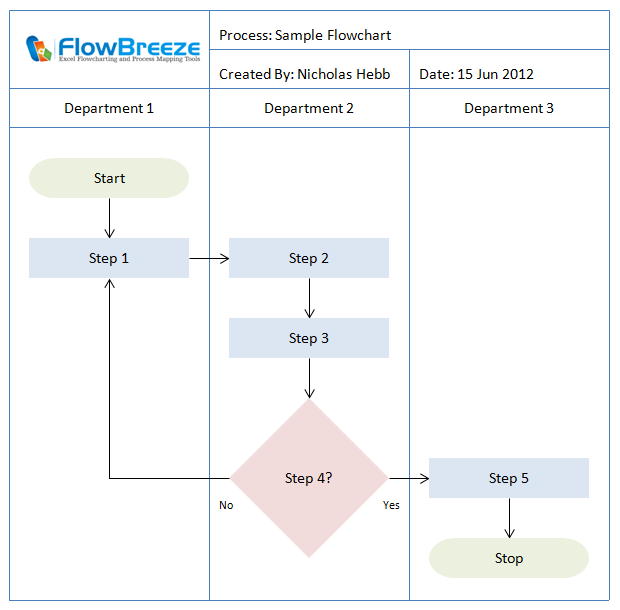
Deployment Flowchart
One of the most common uses of swim lanes is for deployment flowcharts. A deployment flowchart maps the process as it flows from stakeholder to stakeholder. Developed by quality management pioneer Dr. W. Edwards Deming, the original deployment flowcharts depicted how new products were deployed to production. They are also used to benchmark the current state of a process in order to plan improvement activities.
Deployment flowcharts serve multiple purposes:
- Show the steps in a process.
- Identify key stakeholders in a process.
- Show the interactions between stakeholders.
- Identify wastes, such as redundacies and delays.
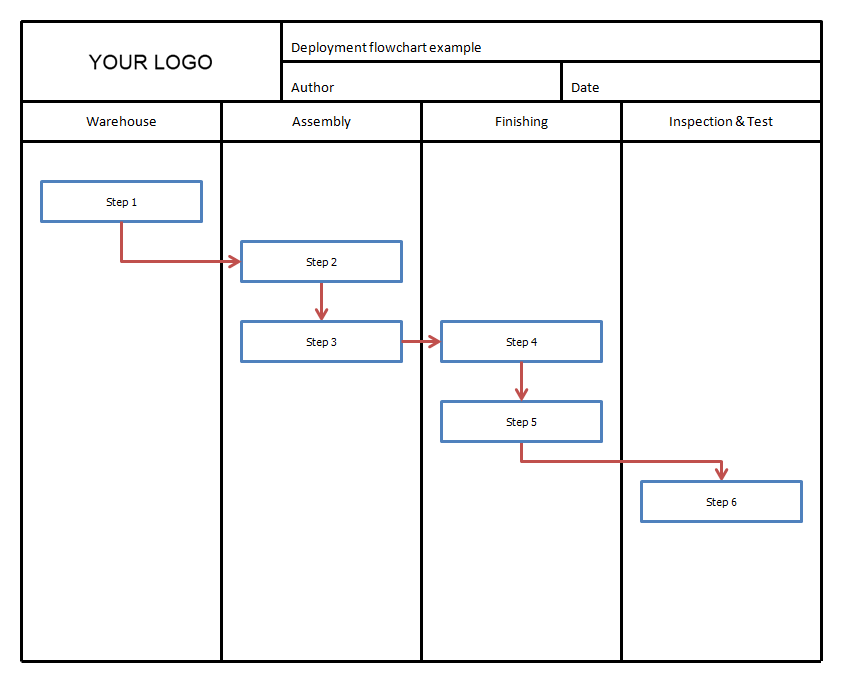
Deployment flowchart example
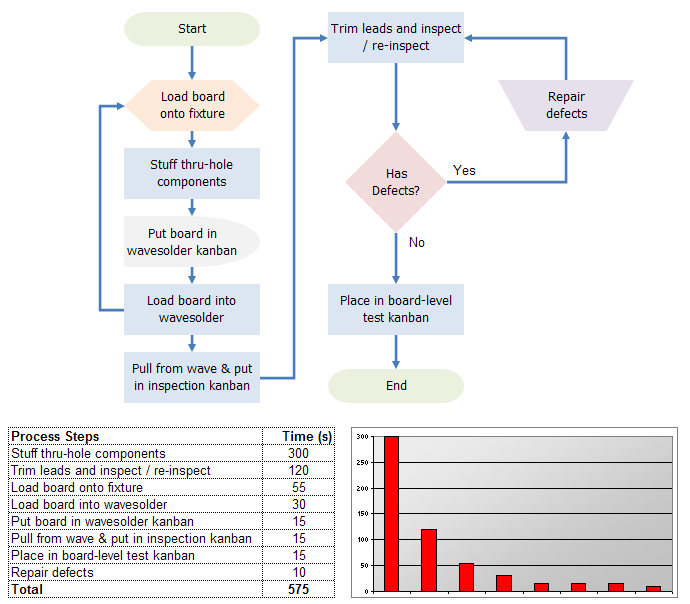
Opportunity Flowchart
Opportunity flowcharts, also know as Value-Added / Non Value-Added (or Cost-Added) flowcharts, are used to identify which steps in a process are wasteful. The first step to create a opportunity flowchart is to identify all the process steps. Next, determine which of the steps add value from the perspective of the customer and which do not. Finally, create the flowchart with each step in the appropriate column.
Non value-added activities include:
- Product changeover tasks, such as machine set-up.
- Material and product movement.
- Queues and kanbans.
- Inventory storage.
- Inspection and testing.
- Rework.
- Anything that does not change the Form, Fit, or Function of the product.
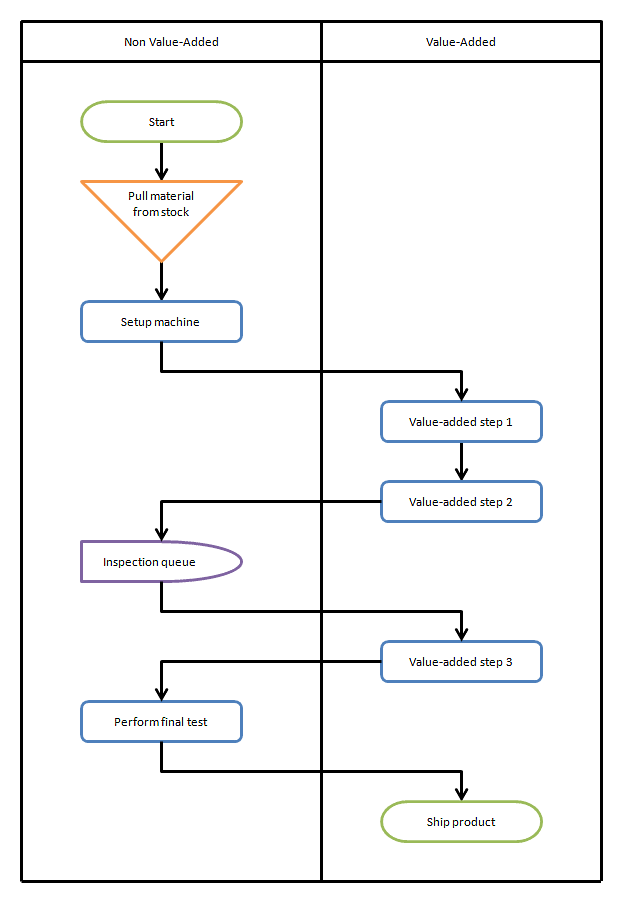
Opportunity flowchart example
Again, non value-added status is from the customer's perspective, and there may be exceptions to the guidelines above. For example, if you make 12 year old, single malt Scotch, storage during aging would be a value added step. Likewise, certain tests or inspections may be required by the customer or regulatory agencies.
A variant on this type of flowchart adds a third category for business value-added activities. These would be tasks that don't add value for the customer but are important for your business, such as accounting, inventory control, or ongoing measurements for quality assurance.
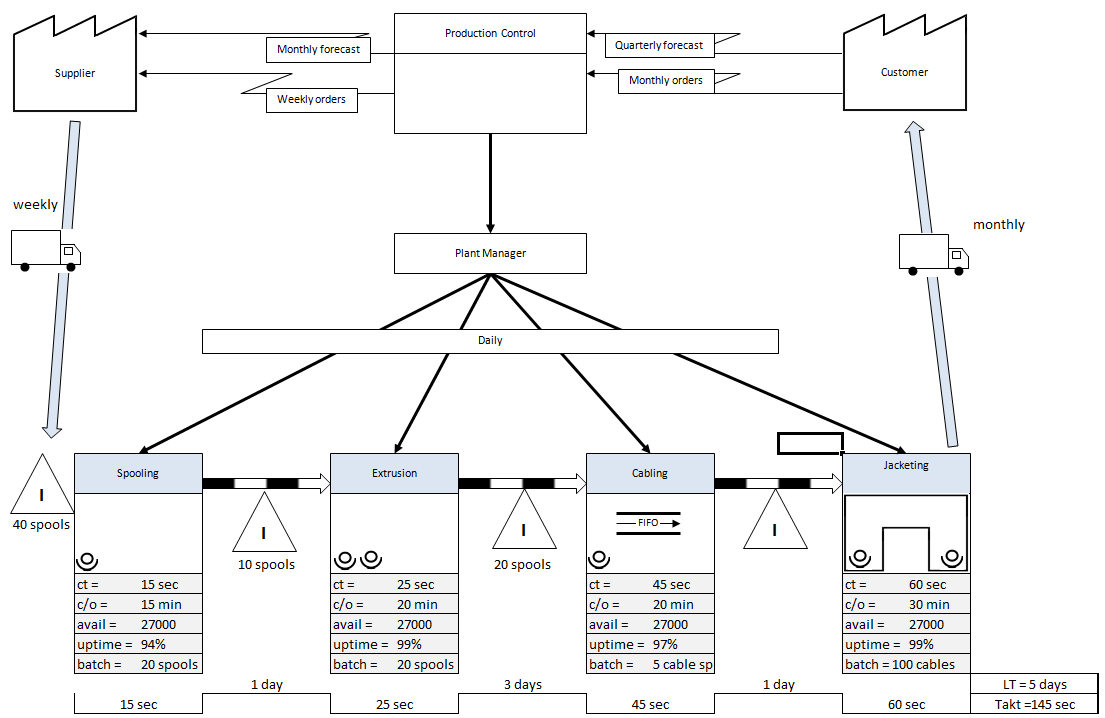
Matrix Flowcharts
Another variation is a matrix with lanes running both horizontally and vertically. The benefit is that you can assign two attributes to a single process step. The downside is that matrix diagrams take up a larger footprint, and despite the added information they can be harder to read. The same effect could be had by using color coding or labeling.
About the Author
Nicholas Hebb
Nicholas Hebb is the owner and developer of BreezeTree Software, makers of FlowBreeze Flowchart Software, a text-to-flowchart maker, and Spreadspeed, an auditing and productivity toolset for Microsoft Excel®.