How to Create Flowcharts Series
10 Tips and Tricks for Making Flowcharts
By Nicholas Hebb
Contents
- The "Yellow Sticky" Flowcharting Method
- Using Deployment Process / Swim Lanes Flowcharts
- Break Apart Complex Processes
- Verify Your Flowchart
- Validate Your Flowchart
- Don't Overlap Flowchart Connectors (Flow Lines)
- Never Use ALL CAPS
- Back to Basics - Flowcharting with Pencil and Paper
- Provide a Symbol Key (Shape Legend)
- Color Coding Flow Chart Shapes
Excel Flowchart Wizard
FlowBreeze is a flowchart add-in for Microsoft Excel that makes creating flowcharts simple and pain free. Free 30-Day Trial.The Yellow Sticky Method
Sometimes a business process is simple. You can sit down at your PC and knock the whole flowchart out in a single sitting. But often flow charts are more complex than that, and they require collaboration with colleagues - spanning organizations, departments, and process expertise levels.
The typical way to collaborate on a flowchart is to map out the processes on a white board. This is OK, but can be messy and time consuming as you erase and re-draw to fine-tune the process flow diagram. The easy way to do this is with the Yellow Sticky Method. ( The "Yellow Sticky Method" is just a phrase coined to describe doing the flowchart on Post It notes .)
Using this method, you draw the flowchart shape and write each process step on a Post It note. Then stick it on the whiteboard. Now it is much simpler to move process flow steps around as you re-arrange and fine tune the flowchart!
And, it's not just useful for collaboration. It can also be useful when mapping out a complex process flows by yourself. Instead of a whiteboard, just stick the Post It note on a piece of paper, your desk, or your wall.
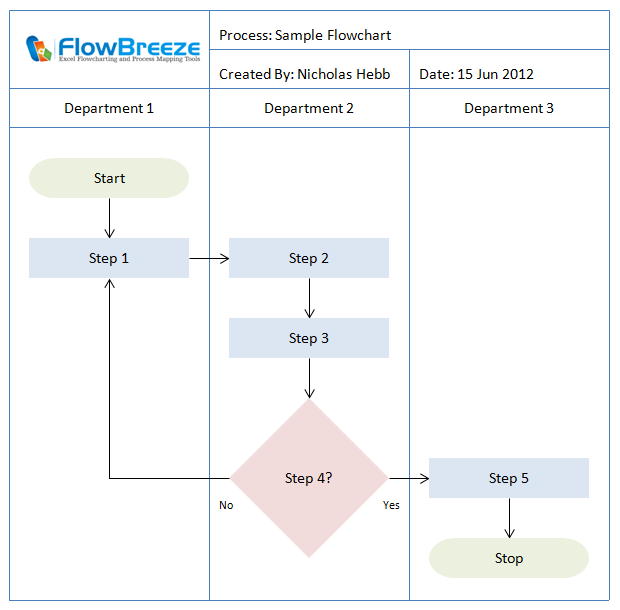
Swim Lane Diagrams / Deployment Flowcharts
Swim lanes are visual channels (rows or columns) in a flowchart that identify the resources used in a process. Resources can be anything but are often things like departments, people, locations, machines, etc. The flowchart is drawn with each process step placed in the swim lane belonging to the appropriate resource used. Swim lanes are useful for displaying the flow of information or materials between resources at a glance.
A deployment flow chart is a special type of swim lane flowchart developed by Dr. W. Edwards Deming. A typical deployment flowchart would show the process steps, roles and interdepartmental interactions required to roll out a product to release.
In Microsoft Excel, it's easy to create swim lanes by creating either row or column labels (depending upon the flowchart direction) and separating the swim lanes with cell borders. Cell shading or patterns can also be used to highlight each swim lane but care should be taken not to make the flowchart look too busy or noisy.
The downside to swim lane diagrams is the constraint that they force on the layout of the flowchart. Flow lines from one process step to another can cross several swim lanes, giving the flow chart a messy, chaotic appearance (especially when there are a number of loop backs to previous process steps crossing swim lane boundaries). Swim lanes also force a flowchart layout to be larger, often increasing the page count of the flowchart.
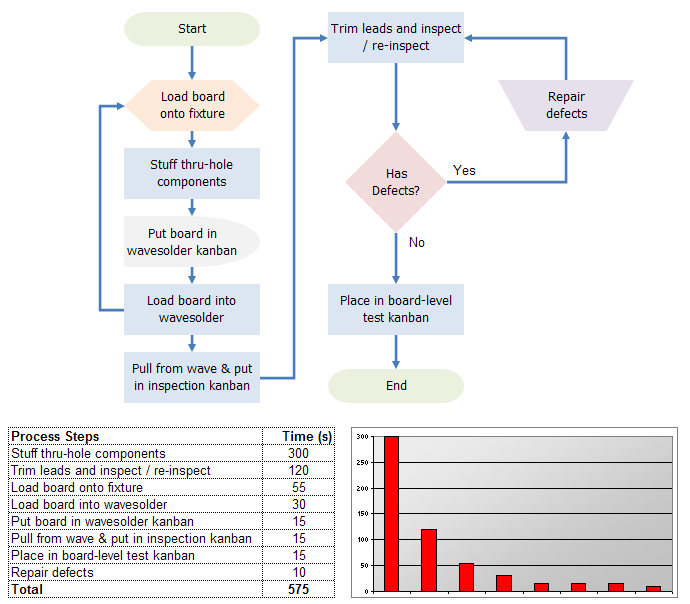
Break Complex Processes out into Parent and Child Processes
If process flowcharts are overly complex, it can be difficult to follow the overall process flow from the flowchart. For cases like these, there are two tricks you can use.
First, you can find sub-processes that can be broken out into a separate flowchart. The parent process flowchart treats the sub-process as a black box, and the sub-process flowchart expands it in detail.
The other method (another alternate to swim lanes) is to create a flowchart for each area of responsibility (e.g., a department). Each area of responsibility is enclosed in a box, with labeled nodes for all input / output points. This method is particularly useful for identifying the interfaces between resources.
Verify Your Flowchart
Does this flowchart actually represent the process you set out to describe and only the process you set out to describe (i.e., no related processes or sub-processes that may be documented elsewhere)?
Sometimes it's easy to get carried away with process flowcharts and add additional information to them. As an example, I've seen procedural flowcharts placed in work instructions that include steps external to the work instruction. These steps were documented in other work instructions, creating a situation where they could become out of sync if the other work instructions were revised.
Validate Your Flowchart
Perform a walkthrough using the actual process. Managers, engineers, and supervisors often create flowcharts to document processes performed by associates. As much as we all think we know our businesses, the truth is no one know their job function like the person actually performing it. For complex or inter-departmental flowcharts, it's best to validate the flowchart by walking through it with the people that perform the job.
For proposed processes not in place yet, get team members to play the role of actors. Have them perform a simulated walkthrough just to do a reality check. Also, if possible, have them do the simulation with actual information or materials and simulate the actions on them. This is a great technique for uncovering flaws in a proposed process before rollout.
Avoid Overlapping Connection Arrows
When lines cross, some flowcharting tools automatically add a little crossover bump to denote that one connector arrow is jumping over the other, but other tools, such as the built-in flowcharting tools in Microsoft Office, do not add the crossover bump. In the latter case, when 2 connection arrows cross over each other, it can be very difficult to tell what the intention is. Can the reader safety assume that each connection arrow continues in a straight line and has no relation to the other connection arrow? Or, does the reader interpret it as a junction point with two or more possible routings?
To avoid this confusion the first alternative is to try to arrange all the shapes so that overlapping connections arrows never occur. Unfortunately, this isn't always possible. So the second alternative is to use connection nodes. Connections nodes are circular shapes with label ID's. Even if your flowcharting software provides a crossover bump, using connection nodes often makes the flowchart cleaner and easier to read.
Never Use ALL CAPS in the Flowcharts
This should go without saying, but I've seen it often enough that it bears repeating. Not only does ALL CAPS text take up more space, but it is harder to read than lowercase text.
Back to Basics - Make Flow Charts with a Pencil and Paper
Before you sit down to draw your flowchart on a PC, map out your flowchart. In a sense this is a re-iteration of the Yellow Sticky Method tip. But if you choose not to use that method, at least go back to basics and write it out with a pencil and paper.
Save yourself some frustration and draw the flowchart out by hand first. It's faster than using most software (except FlowBreeze), and it will save you time in the end. You can pre-optimize the layout and avoid moving shapes around and re-routing connectors.
Provide a Flowchart Symbol Key (a.k.a. Shape Legend)
Most people who create or read flowcharts are familiar with the basic shapes: rectangle is a process step, diamond is a decision, oval is a terminator, circle is a connector, etc. But what about those other shapes, such as alternate process, data (aka, input/output), manual operation? Most people aren't familiar with all of them.
On the other hand, the shapes themselves convey information about the process step. A single glance can tell the reader what type of operation is occurring at a point in the process. So using a minimalist subset of the available shapes isn't always the best option either.
The solution is simple: create a legend of the shapes you're using.
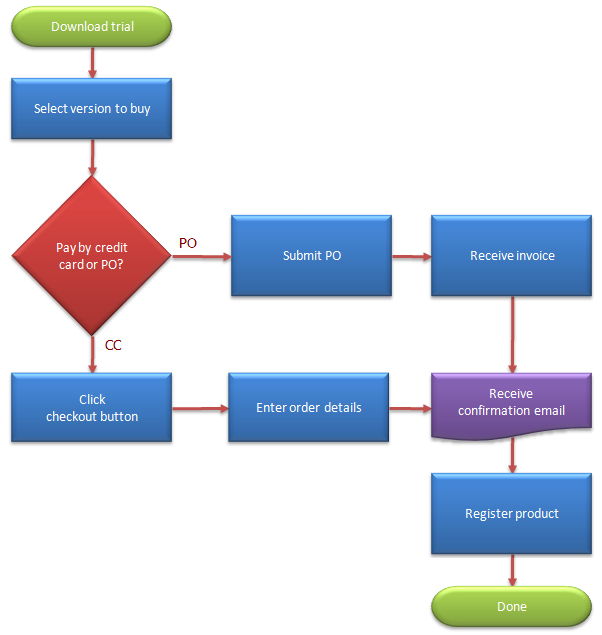
Flowchart Symbol Color Coding
As a alternate to swim lane flowcharts, process steps can be color coded to identify resources. In Excel this can be done by setting an outline or fill color to each flowchart shape (or pattern, which may be better for black and white printing / copying). You will also need to add a legend to the flowchart to identify the resource assigned to each color.
The advantage to color coding is that you can get a similar effect as swim lanes without the layout constraint. This enables greater density to the flowchart and therefore a smaller footprint on the page. The disadvantages to swim lanes are: (1) Too many colors make the flowchart difficult to decipher as the reader is constantly having to refer back to the color legend. (2) They don't have the same at-a-glance readability that swim lane flowcharts provide when trying to observe inter-resource process flow. (3) It's more and more common to see flow charts with every flowchart shape a different color - purely for aesthetics, so color coding could get mistaken for styling.
About the Author
Nicholas Hebb
Nicholas Hebb is the owner and developer of BreezeTree Software, makers of FlowBreeze Flowchart Software, a text-to-flowchart maker, and Spreadspeed, an auditing and productivity toolset for Microsoft Excel®.