Flowcharting in Excel Series
3 Ways to Create Custom Autoshapes
By Nicholas Hebb
Composite Autoshapes
The most basic way to create a custom autoshape is to combine two or more built-in autoshapes using the Group function, as shown in the image below. As you can see, the two autoshapes can have different formatting. It is easiest to apply the formatting to each autoshape individually before grouping them together.
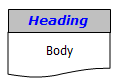
One downside to this type of custom autoshape is the autoshape sizing. For example, if "Heading" was changed to "Really Long Heading", the text would not it in the top section. Resizing the autoshape to get the text to fit would result in both the top and bottom sections being re-sized. So the best way would be to Ungroup the shapes, re-size, and then Regroup the shapes.
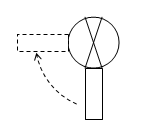
You're not limited to creating text based shape, either. The shape below is a composite of a circle, 2 lines, 2 rectangles, and an arc to form a valve.
Excel Flowchart Wizard
FlowBreeze is a flowchart add-in for Microsoft Excel that makes creating flowcharts simple and pain free. Free 30-Day Trial.Hand Drawn AutoShape
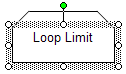
There are many common symbols that are not included in Excel's default set of autoshapes. After all, drawing is a side benefit of Excel, not its main purpose. For example, the Loop Limit symbol (below, right) is used for procedural programming flowcharts. To create this autoshape, you can simply draw a series of line segments, as show in the picture on the left. Note that the sides were created using 2 segments per side to give connection points at the desired locations.
 |
 |
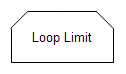 |
One drawback of creating autoshapes this way is that they cannot contain text. The 2nd image above shows a flowchart Process shape added to the Loop Limit symbol. The border of the Process shape was set to "No Line" and the Order was set to "Send to Back". All the line segments and the Process shape are then Grouped together. By adding the Process shape, you can now add text to the Loop Limit symbol as shown. The final autoshape is on the right.
Pictorial AutoShapes
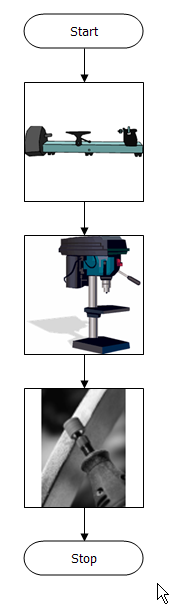
The next type of custom autoshape is created by embedding pictures in autoshapes, as shown below. The simplistic flowchart below shows a lathe, a drill press, and a grinder. You could easily rearrange the symbols so that the process flow roughly matched the shop floor layout. And, of course, the pictures don't have to be machines. You could easily add staff photos and remove the border lines to give your process flows a friendly face, so to speak.
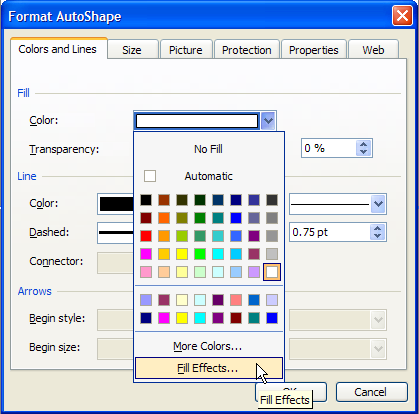
The windows for adding a picture to an autoshape is deeply hidden in Excel 2003 and previous. To access it, add an autoshape (e.g., a rectangle) to the spreadsheet then double-click on the edge of it to bring up the autoshape formatting window. On the Colors and Lines tab, click the Fill Color dropdown and select Fill effects as show below.
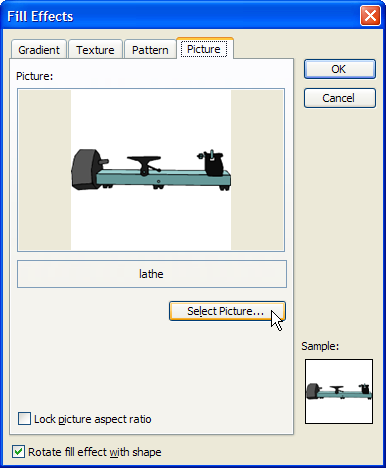
This will open up the Fill effects window. Select the Picture tab, and then click the Select Picture button to browse for the file. After selecting the file, click OK and you're done.
The advantages of putting the pictures into autoshapes instead of just putting them on the drawing are two-fold. First, the autoshapes allow you to attach Connectors to them. Connectors are lines that stay connected (as the name implies) to the shape even when you move it around. This makes it much easier to rearrange or edit your flowchart. Second, it's possible to add text to an autoshape, so you can create annotated pictures.
Bonus Tip #1: How to Add Extra Connection Points to Autoshapes
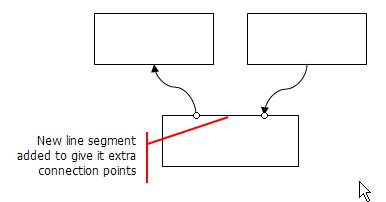
Have you ever wanted more connection points on an autoshape? An easy trick is to draw a line along an edge of an auto shape, starting and ending at 2 places where you'd like connection points to be. Then Group the line and the shape together. The example below shows a Process symbol with a line segment added to its top edge. This gives it 2 extra connection points that arrow Connectors will snap and connect to.
Bonus Tip #2: Crossover Flow Lines (aka Bridges)
Since the time that this was written, experience has taught me not to use this approach. Instead I would recommend one of these approaches:
- Changing one connector type to curved (right-click on the connector and change it via the Connector Type menu option).
- Splitting the connector arrow into two, and using the circular connector node shapes to show a jump from one part of the process to another.
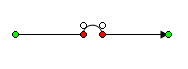
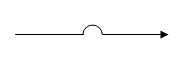
One drawing feature lacking in Excel is the capability to do crossover lines. Crossover lines (also called bridges) allow you to distinguish between 2 intersecting lines. But you can create a crossover line using an Arc and 2 Connectors. Getting the Arc adjusted properly can be tricky, but you can just download the "Custom Autoshapes.xls" file attached to this article and copy the crossover line in it.
 |
 |
To use the crossover line from the Custom AutoShapes sample file (see the download link at the top of the article), click on the left line segment and drag the little circle at the end of it over to connect to the first shape you want to join. Next, click on the arrow connector and drag the arrow end to the second shape you want to join. Then, click on the little crossover bump and drag it into position over the line you are intersecting. If the bump appears behind the other line, then right-click on it and Select Order > Bring to Front.
About the Author
Nicholas Hebb
Nicholas Hebb is the owner and developer of BreezeTree Software, makers of FlowBreeze Flowchart Software, a text-to-flowchart maker, and Spreadspeed, an auditing and productivity toolset for Microsoft Excel®.